Methods of malware analysis: Unpacking drivers in Ring3
In their daily work, in the analysis of Trojans and any Malvari, with sufficient frequency, there are instances that drop encrypted drivers. But I'm a moderately lazy person and I'm used to working in ring3, so I'll show you one of the ways to unpack drivers without resorting to low-level debuggers.
To begin with, it is worth saying that this method is suitable for drivers that import a small number of APIs from the kernel and system libraries. The order of two or three dozen functions. Otherwise, we are waiting for a rather dreary job, this is not worth it.
The driver itself, in its structure is almost identical to the usual dynamic libraries. And to load it into ring3, you need to change a couple of fields in the PE header, namely:
Now you need to untie the driver from the system low-level libraries. To do this, we write our dll (or several, as you like) with the stubs of the necessary functions. Open the list of imported APIs and look for their prototypes in MSDN or other information resources.
In my case, the list is as follows:
')
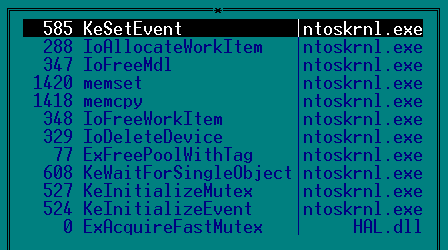
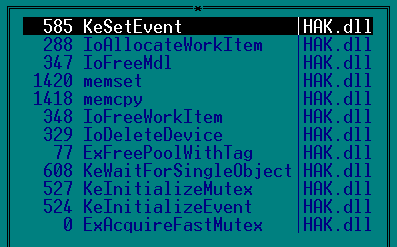
So that the driver could load our dll, and not the system one, we patch the names of imported modules onto the ones we prepared.
Now our driver can be loaded into the user mode debugger, for example OllyDbg.
In this case, the packer is primitive - xor and a variation of the LZ algorithm. I will not consider the xor decryptor, despite the fact that it is a bit littered. After decryption, we get to the following code:
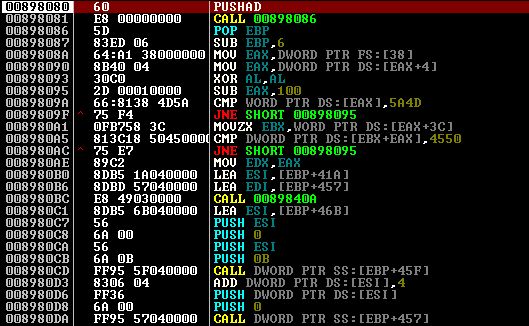
That is the first trouble. If you just let go of the code to be executed, then immediately we say exception ACCESS_VIOLATION. The code takes from the service structures the address inside ntoskrnl.exe and finds the ImageBase module. But since we are in ring3, the structure in the FS segment is different from the nuclear one. And if the code is tracked, then fs: [38] counts as 0, and the next command will read at address 0 + 4. Naturally, we don’t have any ntoskrnl in our memory either, so suppose that we’ll manage with the address ntdll (most of its APIs coincide with the nuclear functions).
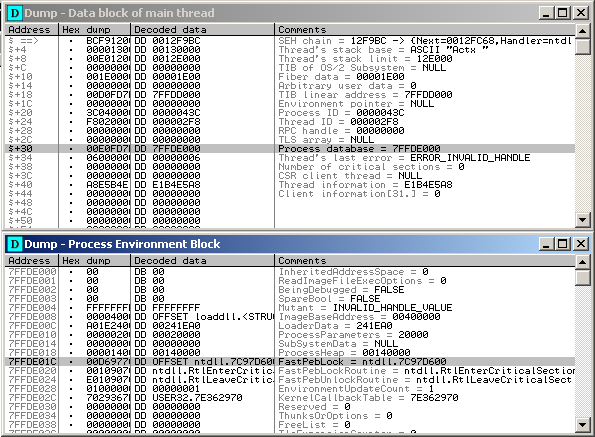
Open the memory card and see what is in the FS segment. Must see tib - thread information block. Having looked a little, you can see in it the pointer to PEB - Process Environment Block. Choose any suitable address in ntdll (I chose PEB.FastPebLock).
You can simply for the NOP code, and in the course of the trace, replace the address with ntdll. But we will act differently - change the bias.
The next problem we encounter in the course of the trace is that the unpacker dynamically receives the addresses of the necessary nuclear functions. In the screenshot you can see the loop for iterating over the list of names with the pseudo-function xGetProcAddress, which is analogous to the system one. Its beginning, where it parses the MZ header, can be seen at the bottom.
At the same time, EDX indicates the list of names of necessary functions

Attentive will notice a little below the compressed MZ-header, but more on that later.
It seems nothing unusual. Everything would be fine, but only in ntdll there are some necessary APIs, or at least similar in prototype. But if you think a little, there are those in kernel32.dll.
Gently can be replaced by
We change the names of non-existent functions, for any existing ones, in order to just correctly work out xGetProcAddress. I replaced them with NtClose.

Carefully tracing, we replace the NtClose address in the registers with the addresses we need from kernel32.dll. After working out the cycle, all the necessary addresses are obtained, as seen in the image below. This problem is over, follow on.

We are convinced that the ExAllocatePool we replaced with GlobalAlloc is working steadily.
Unnoticed went to unpacking.
Probably the code was written on assembler, as there is nothing superfluous. The code on the screen makes memory allocation, unpacking into it, then preparing the image, zoning and cleans the memory, and if it is successful, it jumps on the OEP.
I didn’t study the unpacking algorithm, because it seemed to me that the compressed data seemed similar to the LZW variant.
The unpacker does not use any API, so it is run quickly and without problems. Actually, immediately after that you can do a dump of the region with a clean driver. But I was wondering how much it would be possible to advance in the analysis, being in ring3.
The PrepareImage function prepares an unpacked image: makes REMAP sections for the required offsets, obtains API addresses from the import, recalculates addresses using the relocations table.
The next sticks in the wheels of us are fussing the cycle of searching for functions for the IAT, which not only requests modules that we don’t have (ntoskrnl, hal, etc.), but also functions accordingly.
As you can see, I already got caught and entered the cycle, but having changed the EIP to 0x008982d7, having reduced ESP and set EAX = 0, I more or less correctly left it. Editing relocs doesn’t bring us any trouble, and we finally get to OEP. But this will have to stop, since import addresses have not been restored, and I don’t see any point in writing another dll with stubs. Clean code can already be analyzed statically in a disassembler.
Before:
…and after:

In order not to torture you by hammering the lines from the bottom screenshot into the search, I’ll say at once that this is one of the versions of Rustock
Once again, I am convinced that my laziness makes one pervert even longer than it could be done with a head-on solution.
Introduction
To begin with, it is worth saying that this method is suitable for drivers that import a small number of APIs from the kernel and system libraries. The order of two or three dozen functions. Otherwise, we are waiting for a rather dreary job, this is not worth it.
Driver preparation
The driver itself, in its structure is almost identical to the usual dynamic libraries. And to load it into ring3, you need to change a couple of fields in the PE header, namely:
- Type Subsystem with Native on Windows GUI. (In PeTools, the Optional Header button);
- In the IMAGE_FILE_HEADER.Characteristics field, set the Dll attribute. (In PeTools, the File Header button and then Characteristics);
Now you need to untie the driver from the system low-level libraries. To do this, we write our dll (or several, as you like) with the stubs of the necessary functions. Open the list of imported APIs and look for their prototypes in MSDN or other information resources.
In my case, the list is as follows:
')
So that the driver could load our dll, and not the system one, we patch the names of imported modules onto the ones we prepared.
Now our driver can be loaded into the user mode debugger, for example OllyDbg.
Unpacking and troubleshooting as you progress
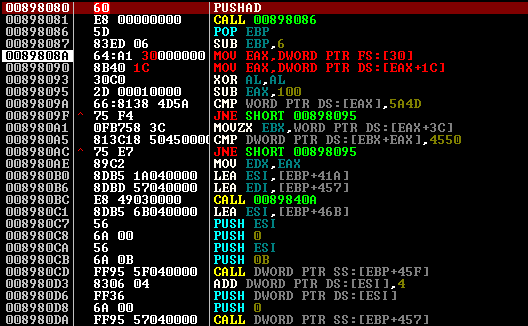
In this case, the packer is primitive - xor and a variation of the LZ algorithm. I will not consider the xor decryptor, despite the fact that it is a bit littered. After decryption, we get to the following code:
That is the first trouble. If you just let go of the code to be executed, then immediately we say exception ACCESS_VIOLATION. The code takes from the service structures the address inside ntoskrnl.exe and finds the ImageBase module. But since we are in ring3, the structure in the FS segment is different from the nuclear one. And if the code is tracked, then fs: [38] counts as 0, and the next command will read at address 0 + 4. Naturally, we don’t have any ntoskrnl in our memory either, so suppose that we’ll manage with the address ntdll (most of its APIs coincide with the nuclear functions).
Open the memory card and see what is in the FS segment. Must see tib - thread information block. Having looked a little, you can see in it the pointer to PEB - Process Environment Block. Choose any suitable address in ntdll (I chose PEB.FastPebLock).
You can simply for the NOP code, and in the course of the trace, replace the address with ntdll. But we will act differently - change the bias.
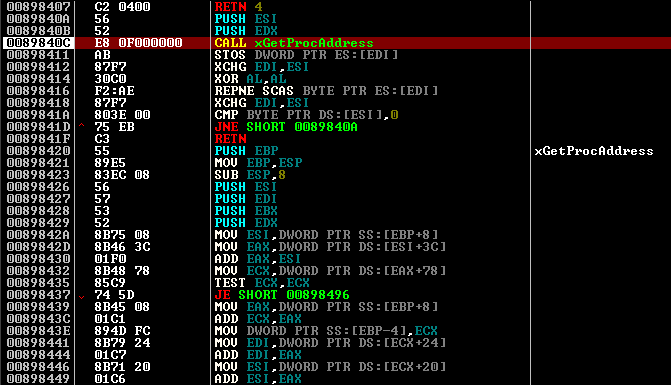
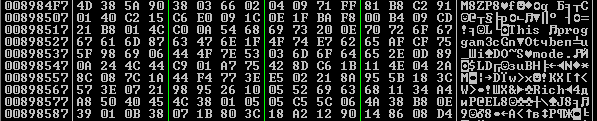
The next problem we encounter in the course of the trace is that the unpacker dynamically receives the addresses of the necessary nuclear functions. In the screenshot you can see the loop for iterating over the list of names with the pseudo-function xGetProcAddress, which is analogous to the system one. Its beginning, where it parses the MZ header, can be seen at the bottom.
At the same time, EDX indicates the list of names of necessary functions
Attentive will notice a little below the compressed MZ-header, but more on that later.
It seems nothing unusual. Everything would be fine, but only in ntdll there are some necessary APIs, or at least similar in prototype. But if you think a little, there are those in kernel32.dll.
PVOID ExAllocatePool(POOL_TYPE PoolType, SIZE_T NumberOfBytes); VOID ExFreePool(PVOID P);PVOID ExAllocatePool(POOL_TYPE PoolType, SIZE_T NumberOfBytes); VOID ExFreePool(PVOID P);
Gently can be replaced by
- HGLOBAL WINAPI GlobalAlloc (UINT uFlags, SIZE_T dwBytes);
- HGLOBAL WINAPI GlobalFree (HGLOBAL hMem);
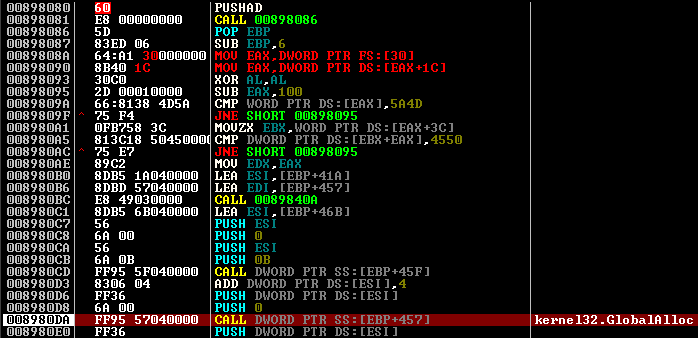
We change the names of non-existent functions, for any existing ones, in order to just correctly work out xGetProcAddress. I replaced them with NtClose.
Carefully tracing, we replace the NtClose address in the registers with the addresses we need from kernel32.dll. After working out the cycle, all the necessary addresses are obtained, as seen in the image below. This problem is over, follow on.
We are convinced that the ExAllocatePool we replaced with GlobalAlloc is working steadily.
Unnoticed went to unpacking.
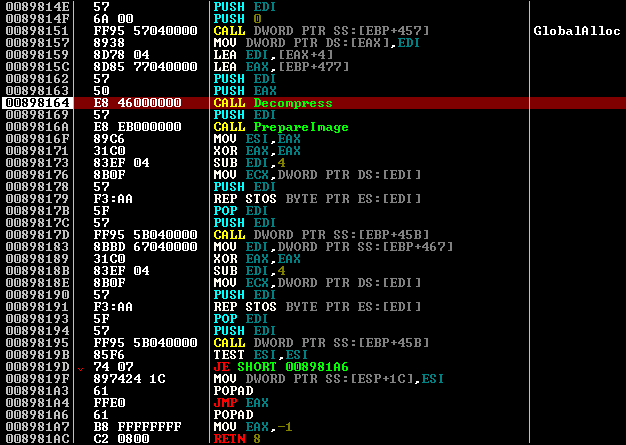
Probably the code was written on assembler, as there is nothing superfluous. The code on the screen makes memory allocation, unpacking into it, then preparing the image, zoning and cleans the memory, and if it is successful, it jumps on the OEP.
I didn’t study the unpacking algorithm, because it seemed to me that the compressed data seemed similar to the LZW variant.
The unpacker does not use any API, so it is run quickly and without problems. Actually, immediately after that you can do a dump of the region with a clean driver. But I was wondering how much it would be possible to advance in the analysis, being in ring3.
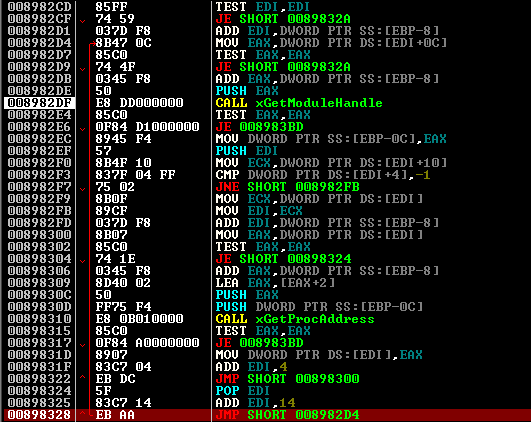
The PrepareImage function prepares an unpacked image: makes REMAP sections for the required offsets, obtains API addresses from the import, recalculates addresses using the relocations table.
The next sticks in the wheels of us are fussing the cycle of searching for functions for the IAT, which not only requests modules that we don’t have (ntoskrnl, hal, etc.), but also functions accordingly.
As you can see, I already got caught and entered the cycle, but having changed the EIP to 0x008982d7, having reduced ESP and set EAX = 0, I more or less correctly left it. Editing relocs doesn’t bring us any trouble, and we finally get to OEP. But this will have to stop, since import addresses have not been restored, and I don’t see any point in writing another dll with stubs. Clean code can already be analyzed statically in a disassembler.
Instead of output
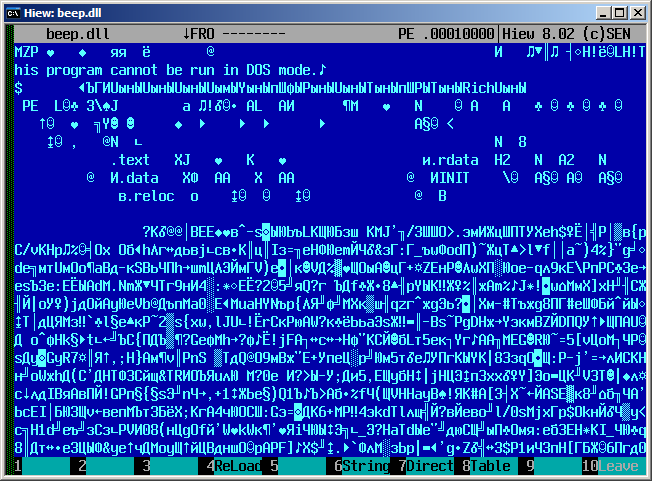
Before:
…and after:
In order not to torture you by hammering the lines from the bottom screenshot into the search, I’ll say at once that this is one of the versions of Rustock
Once again, I am convinced that my laziness makes one pervert even longer than it could be done with a head-on solution.
Source: https://habr.com/ru/post/133409/
All Articles