Highstock: monitoring Runet Premium
 For a long time in my projects I used Flash-graphics, instead of ordinary images. They are both prettier and more functional, and the server does not need to strain to generate images. But due to the fact that some firms are not very friendly with Flash, I had to look for a replacement without using Flash.
Before that, I used AmCharts, first of all I looked at their website, they already released the JS version of their charts, but somehow they didn’t like it, it felt damp. After a brief googling, Highstock, from the authors Highcharts JS, was found. It differs primarily in the ability to display graphs tied to time, with a large number of points, scaling, easy navigation. Yes, and superficially liked more AmCharts.
Data collection
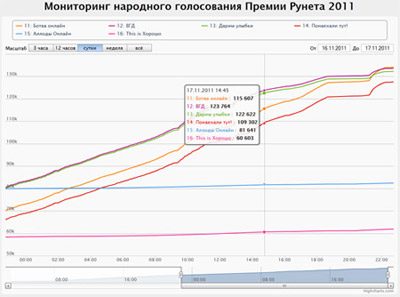
For training, so that it was not too boring, I decided to make a simple page with monitoring the results of the popular vote of the Runet Prize. So you can practice with the schedule, and see if there will be anomalous behavior on the ballot (usually talking about cheating).
')
Especially I will not paint training, in general. Since I don’t have anything to do with the award itself, I simply wrote a PHP script that downloads the main page, parses it with regulars, and then puts the number of votes and positions in the database. The script is hung on crowns and runs every 5 minutes.
Data preparation
So, there is data, now you need to think about how to display them. Since the sites participating in the voting of 50 pieces, plus the gaps between the sites are 2 orders of magnitude, it does not make sense to display all the sites together. Having a little thought, I stopped at the following output options:
- By default, the first 3 positions are displayed.
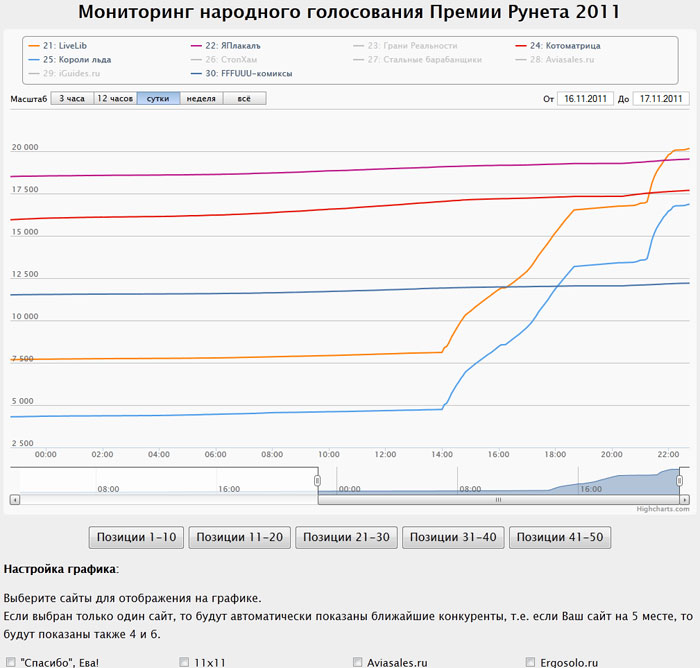
- The ranges of 10 positions (1-10,11-20, etc.).
- Selection of specific sites (1,3,10).
- If only one site is selected, then its closest competitors are also shown, one to the position above, the other to the position below.
- A simple array with values for the Y axis; in such cases, the X values are calculated automatically in accordance with the specified rules.
data: [0, 5, 3, 5] - An array containing the X, Y values.
data: [[5, 2], [6, 3], [8, 2]] - An array of objects is the most advanced option, allowing at least every point to adjust.
data: [{ name: ' 1', color: '#00FF00', y: 0 }, { name: ' 2', color: '#FF00FF', y: 5 }]
Also, since I need to display several graphs, I decided to get rid of the duplication of time. As a result, the PHP script generates data in JSON format:
data: [ [1, id1val, id2val,…,idNval], // [2, id1val, id2val,…,idNval], // … ] Where the first value means time (timestamp is divided into 300 seconds and the starting time is taken away). To convert data into separate arrays for each graph, we write the function
// var c = info.data.length; // for(var i = 0, l = info.title.length; i < l; i++){ seriesOptions[i] = { name: info.title[i], // data: [] // }; for(var j = 0; j < c; j++){ // timestamp seriesOptions[i].data.push([(info.data[j][0] + 4404683) * 300000, info.data[j][i+1]]); } } Customize the look of graphics
To begin with, we will translate the displayed inscriptions into Russian, change the thousands separator, and make sure that the time is not displayed in UTC, but in the user's local time.
Highcharts.setOptions({ lang: { rangeSelectorZoom: 'c', rangeSelectorFrom: '', rangeSelectorTo: '', thousandsSep: ' ' }, global: { useUTC: false } }); Next, customize the appearance with the help of the options object. First general options.
chart: { renderTo: 'chart', // DIV zoomType: 'x', // X backgroundColor: '#f9f9f9' // } Setting the buttons for selecting time intervals.
rangeSelector: { buttons: [{ // type: 'hour', // : 'millisecond', 'second', 'minute', 'day', 'week', 'month', 'ytd' ( ), 'year' and 'all' count: 3, // type text: '3 ' }, { type: 'all', text: '' }], inputDateFormat: '%d.%m.%Y', // inputEditDateFormat: '%d.%m.%Y', buttonTheme: { width: 60 // }, selected: 2 // } Now let's take a pop up hint (displayed when hovering over the chart)
tooltip: { backgroundColor: 'rgba(250, 250, 250, .85)', // borderColor: 'rgba(100, 100, 100, .90)', // ( ) xDateFormat: '%d.%m.%Y %H:%M', // // headerFormat: '<span style="font-size: 12px">{point.key}</span><br/>', // , , pointFormat: '<span style="color:{series.color}">{series.name}</span>: <b>{point.y}</b><br/>' } Turn on and customize the legend (by default it is turned off). Brought up as the output
under the chart, while it works clumsily (superimposed on the time scale), as well as the output on the side (long names are not cut correctly)
legend: { enabled: true, align: 'center', itemWidth:234, // , 4 verticalAlign: 'top' } Result
After all gathered in a heap, we add for convenience buttons of a choice of sites. And watch the "battle of the titans."
This is how it looks like :
In the near future, I also want to tighten the auto-update so that every 5 minutes only new points are downloaded and added to the schedule. But there are still quite a few glitches in the library, with not very standard actions.
And finally, some links:
Highcharts and Highstock official website
Docs on Highstock API
The official website amCharts
Source: https://habr.com/ru/post/132941/
All Articles