Tsung: Web Application Load Testing

Tsung is a distributed load testing system written in Erlang. Declared support for HTTP, WebDAV, SOAP, PostgreSQL, MySQL, LDAP and XMPP / Jabber. In this article I will describe how to test a regular web site for the load.
Why Tsung
First this app is free. Secondly, the application is written in Erlang, which gives it an advantage over other products in the ability to simulate a huge number of simultaneous requests.
Installation
To install you will need a Linux distribution, I used debian. It is necessary to do the following sequence of actions:
- apt-get install erlang
- apt-get install gnuplot-nox libtemplate-perl libhtml-template-perl libhtml-template-expr-perl
- Download the latest version of tsung-1.4.1.tar.gz
- Unpack tar -zxvf tsung-1.4.1 .tar.gz
- Install ./configure && make && make install
- You also need to create a directory named .tsung in the root directory and the tsung.xml configuration file inside it (more about it below)
That's all the installation is complete!
')
Customization
All settings are stored in the xml file tsung.xml. First of all, you need to specify the server being tested, as follows:
<servers> <server host="example.com" port="80" type="tcp"></server> </servers> Further, the address of the emulated client, for large-scale tests, it is recommended to change the maxusers threshold:
<clients> <client host="localhost" use_controller_vm="true" maxusers="7000"/> </clients> And the most interesting, the desired load. Tsung simulates user visits. The following example illustrates 2 phases. The first lasts 5 minutes and every second site is visited by 10 new users, a total of 5 minutes x 10 users / sec = 3000 users. The second phase further increases the load and lasts 10 minutes, every second comes 25 users, in the amount of 15,000 users.
<load> <arrivalphase phase="1" duration="5" unit="minute"> <users arrivalrate="10" unit="second"/> </arrivalphase> <arrivalphase phase="2" duration="10" unit="minute"> <users arrivalrate="25" unit="second"/> </arrivalphase> </load> Instead of arrivalrate, you can also use
<users interarrival="2" unit="second"/> in this case, the user will come every 2 seconds.The next stage is the most important, the creation of a sequence of actions that the simulated user will perform, the so-called session. In order to fully test the capabilities of the site, you need to try so that users constantly do something, that is, do not idle.
<sessions> <session name="rec20111101-1537" probability="100" type="ts_http"> <request><http url="/test/test.html" version="1.1" method="GET"/></request> <request><http url="/css/global_mainPage.css" version="1.1" method="GET"/></request> ... <thinktime random="true" value="15"/> </session> <session> .... </session> <sessions> Automatic session generation
Session can be created manually, but there is an easier way - use tsung proxy to record your actions on the site. To do this, you only need to register in the settings of your browser an ip server where tsung and port 8090 is installed. Next, you need to run the tsung-recorder start command to browse the site, simulate the behavior of a regular visitor. To stop recording tsung-recorder stop . After that, the generated sequence will appear in ~ / .tsung / tsung_recorderyyyymmdd-HH: MM.xml. Then you just need to copy this session to the main tsung.xml file.
Launch
Finally, when all the preparatory actions have been done, you can run our test. To do this, enter the tsung start command, to stop, respectively, tsung stop . Tsung will write the log to the ~ / .tsung / log / yyyymmdd-HH: MM directory. A very important point in large-scale tests, before starting to set the value of ulimit to more than the standard in my case, 1024, ulimit -n 100000 . To view the status of the number of users on the site, you can use the tsung status command. The generated log is placed in the directory .tsung / log / yyyymmdd-HH: MM .
Report and chart generation
To generate reports, use the perl script that comes with the program - tsung_stats.pl. The script must be run from the directory with the log, the command perl tsung_stats.pl . After that a wonderful html report and charts are generated.
Tsung provides statistics:
- Performance: response time, connection time, transactions, requests per second
- Errors: statistics on returned errors
- Server Behavior: Busy graph of CPU and memory, network. SNMP
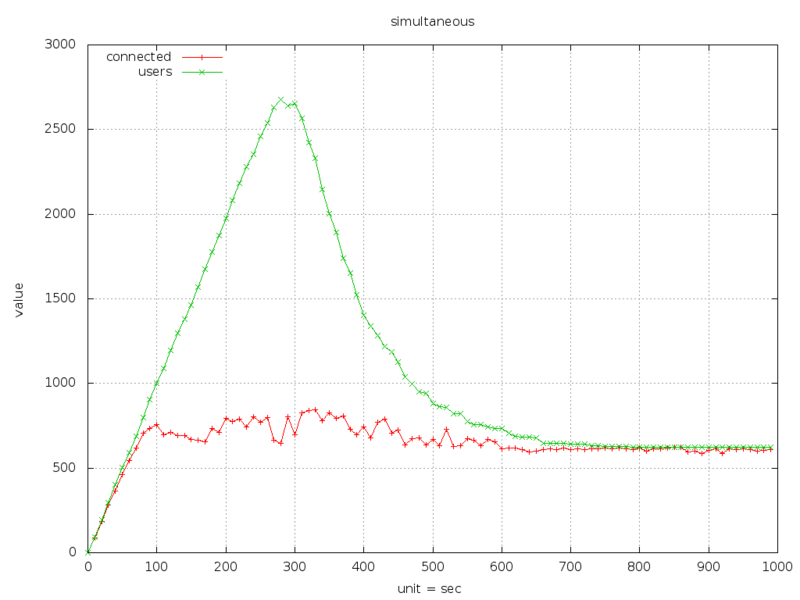
Here is an example of one of the diagrams (the number of users on the site, and the number of users generated):
More charts on the developer site
Sources:
Tsung Guide
Source: https://habr.com/ru/post/132459/
All Articles