Debugging PHP applications on a remote host using XDebug and vim on Linux
Introduction
In PHP applications, debugging with var_dump , debug_backtrace, and other useful functions is not always convenient, and there is a need for a full-featured debugger. This article is for those who for some reason do not want to use an IDE that supports debugging PHP applications out of the box, like NetBeans or PhpStorm, but wants to use vim for this purpose, and at the same time debugging occurs on a remote host.
For vim, there is a DBGp client plugin, but it allows you to debug normally only if the paths to all files on the remote and local machines are the same. For example, if you have a local machine:
/ home / user / application /
/ home / user / framework /
and on the remote machine they are located in:
/ var / www / html / application /
/ var / www / framework /
then debugging the application using the “DBGp client” will not work, since it does not know anything about the other source location.
In this article we will consider:
- Briefly - setting all necessary for remote debugging of the application.
- Modification of the plugin to support various paths.
- Briefly - use the debugger.
Installation
Configuring vim on a local host
Download and install the plugin:
$ cd ~ / .vim
$ wget www.vim.org/scripts/download_script.php?src_id=7285 -O debugger.zip
$ unzip debugger.zip
$ rm debugger.zip
Note: vim should be compiled with python support, you can check it with the help of " : version ", the output should contain the string "+ python".
')
Install and configure Xdebug on a remote host
Install the Xdebug extension any way you like. For example, on Debian Squeeze, this is done simply:
# apt-get install php5-xdebug
But in general, it is better to read the official installation instructions .
Configure the connection to the local debug client - for this in php.ini write the following lines, replacing 192.168.1.110 with the IP of the local machine (if necessary, the port can also be reconfigured):
xdebug.remote_enable = 1
xdebug.remote_port = 9000
xdebug.remote_host = 192.168.1.110
Configuring file matching
The idea is simple - when sending a request to a debager (for example, setting a breakpoint), we must convert the path on the local host to the path on the remote host, and vice versa, when receiving information from the debager (for example, that it is now on some line some file), we have to do the inverse transform.
We add the following code to the end of the debugger.py file:
class FileMapping: def __init__(self, mapping_file): self.local_to_remote = {} self.remote_to_local = {} mapping = open(mapping_file, 'r') for line in mapping: local, remote = line.split(' ') local = local.strip() remote = remote.strip() if not (local in self.local_to_remote): self.local_to_remote[local] = [] self.local_to_remote[local].append(remote) if not (remote in self.remote_to_local): self.remote_to_local[remote] = [] self.remote_to_local[remote].append(local) def local_to_remote_file(self, local): for local_path in self.local_to_remote.keys(): if local.startswith(local_path): # use the first mapping as we don't know which one we should take remote_path = self.local_to_remote[local_path][0] return remote_path + local[len(local_path):] def remote_to_local_file(self, remote): for remote_path in self.remote_to_local.keys(): if remote.startswith(remote_path): for local_path in self.remote_to_local[remote_path]: local = local_path + remote[len(remote_path):] # use the first existing file if os.path.exists(local): return local return None file_mapping = FileMapping('/home/alexey/mapping') And in the mapping file ( / home / alexey / mapping - replace with your own path) we write the correspondence between local and remote directories, for example:
/ home / alexey / framework / var / www / framework
/ home / alexey / application / var / www / html
We look through the code of the plugin in search of places where file names come from Xdebug. As a result, they all boil down to calling one method - set_srcview, at the beginning of which we add a change to the file name:
def set_srcview(self, file, line): """ set srcview windows to file:line and replace current sign """ file = file_mapping.remote_to_local_file(file) Now we are looking for places where, on the contrary, the file names are transferred from the debug client to Xdebug. There are two such places:
1. Debugger class, run method, replace string
'-t line -f ' + self.breakpt.getfile(bno) + ' -n ' + str(self.breakpt.getline(bno)) + ' -s enabled', \ on
'-t line -f ' + file_mapping.local_to_remote_file(self.breakpt.getfile(bno)) + ' -n ' + str(self.breakpt.getline(bno)) + ' -s enabled', \ 2. Debugger class, mark method, replace the string:
'-t line -f ' + self.breakpt.getfile(bno) + ' -n ' + str(self.breakpt.getline(bno)), \ on
'-t line -f ' + file_mapping.local_to_remote_file(self.breakpt.getfile(bno)) + ' -n ' + str(self.breakpt.getline(bno)), \ Already corrected debugger.py can be found here .
Using
We start debugging
To start debugging a web application, you need to start vim and press <F5>.
Further, within 5 seconds (the procedure for increasing the interval is described below), you need to run a PHP script by passing the GDE variable XDEBUG_SESSION_START to 1, for example, simply opening the corresponding page in the browser, for example:
webdev / debug.php? XDEBUG_SESSION_START = 1
Alternatively, in php.ini, you can set the variable xdebug.remote_autostart . In this case, when running any PHP script, Xdebug will try to connect to the debug client.
Read more in the official Xdebug documentation .
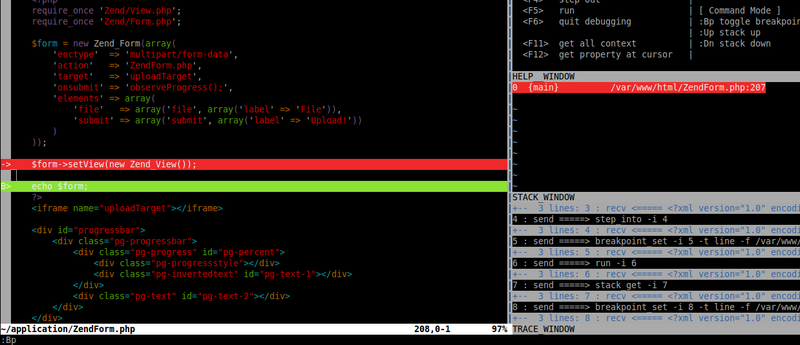
As a result, something like this should turn out - the script that you launched should open:

Windows on the right - from top to bottom:
- WATCH WINDOW - context view
- HELP WINDOW - a brief description of the features
- STACK WINDOW - function call stack
- TRACE WINDOW - debug-client chat log with Xdebug, it is useful to see if debugging did not work
Customize
The timeout can be set in the same script by finding the line in debugger.py:
serv.listen(5) and replacing 5 with the number of seconds you need.
The key combinations are set in debugger.vim, for example, I reassigned <F5> to pressing “, dr” for myself:
map, dr: python debugger_run () <cr>
Text in HELP WINDOW can be changed in the HelpWindow class, the on_create method.
Code Navigation
I will not describe in detail, the differences from other debuggers are minimal here:
- Step into (<F2>) - step into the functions.
- Step over (<F3>) - step without entering the functions.
- Step out (<F4>) - exit from the function by stack up.
- Run (<F5>) - continue execution until the next breakpoint.
- Stack up (: Up) - move up the stack (see STACK WINDOW).
- Stack down (: Dn) - go down the stack (see STACK WINDOW).
View current status
- Property get (<F12>) - get the value of the variable (put the cursor on the desired variable and press <F12>).
- Context get (<F11>) - get the entire current context (roughly speaking, all variables available in this context).
- Eval (, e) - execute an arbitrary expression in the current context and get its value.
In the screenshot, WATCH WINDOW with Context get and Eval completed:

Setting breakpoints
Toggle breakpoint (: Bp) - set the breakpoint in the current line, or delete if it already exists.
In the screenshot, the green line is a line with breakpoint, the red line is the current line:
Resize
Additionally, by <F1> you can switch between two modes - full, when various auxiliary windows are shown on the right, and simple - when only a window with a code remains.
Source: https://habr.com/ru/post/132291/
All Articles