TEL Hosting Monitoring System
Today we will have a small post about the development of TEL specialists - the Simple View monitoring system used in particular in our TEL Hosting data center. We will not talk about all the possibilities, but will only focus on those options that may be potentially interesting to users of data center services. Although, we are sure that this information will be very interesting for representatives of many data centers.
The monitoring system that is used to track TEL Hosting equipment is an in-house development of our company's specialists. The main diagram shows the location of server cabinets and temperature sensors located inside the containment area of our data center.
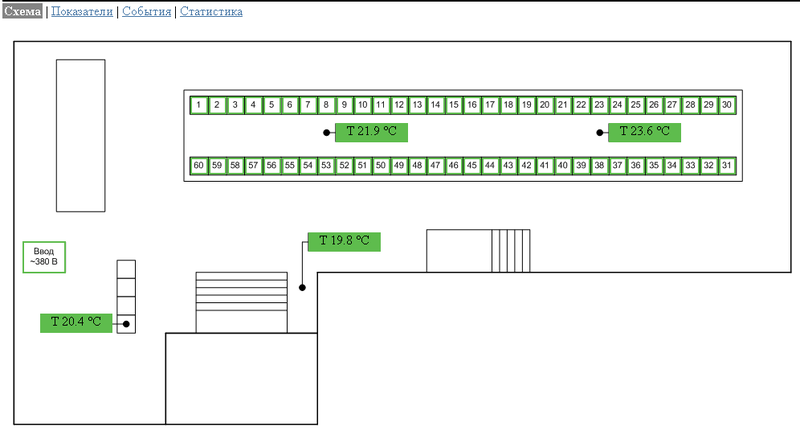
In this screenshot you can see that the temperature at different ends of our cold corridor is significantly different (21.9 and 23.6 degrees Celsius). This fact has a very simple explanation, on the left side of the corridor there is a perforated raised floor, here, at the moment, there are high-loaded blade systems and, in general, a high server installation density. In order not to consume electricity for cooling the rest of the corridor, in which the equipment has not yet been installed, our engineers decided to replace the perforated tile with airtight and close unused cabinets with plugs, reducing the useful volume of the cold corridor, and thereby increasing the efficiency of the cooling system.
')
If suddenly, the temperature on any of the sensors begins to deviate from the established range, the system will alert the engineers with a message to the e-mail and SMS to the mobile phone, which will allow the most promptly make the necessary corrections to the equipment.
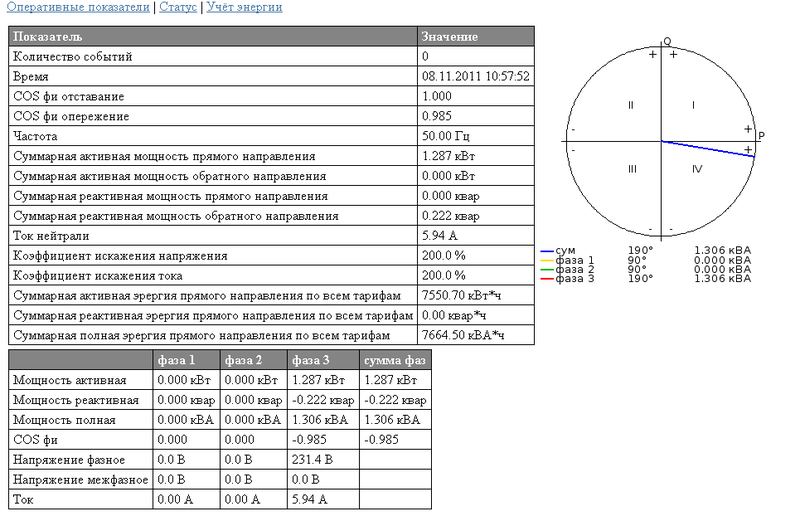
Let us turn to another item that may be of interest to our potential customer. Calculation of energy consumption. In our system, we can choose any of the racks, and see its power consumption and other energy indicators, for example - the angle between the phase voltages. Each rack has two independent power inputs (Pilot 1, Pilot 2), which ensures uninterrupted operation of the equipment in case of emergency shutdown of one of the power inputs.

The plate shows the readings of the counters (electronic sensors) taken from 6 <blocks> (phases) into which each rack is divided. We can open the data for each meter and see more.
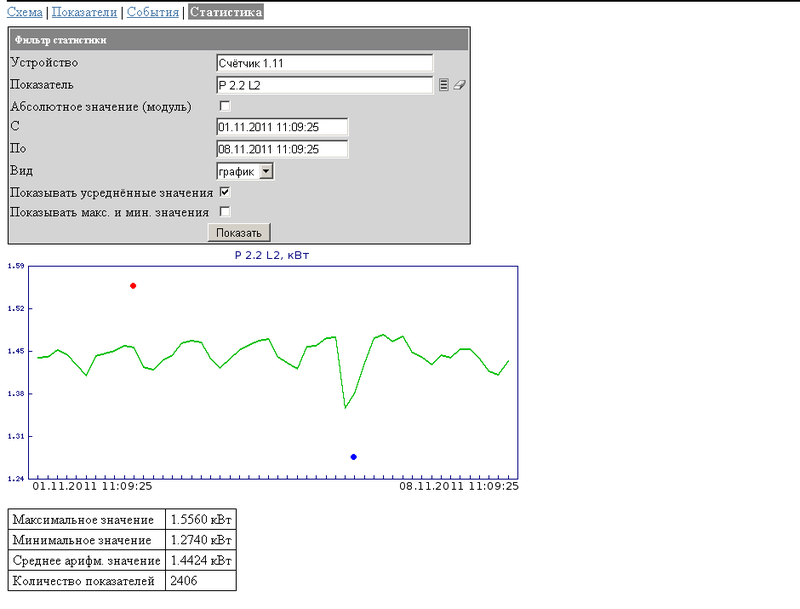
But we, as a consumer of electricity, are more interested in another tab. The system allows you to see in dynamics, for a period of time, as the power consumption for each phase, as well as the entire server cabinet or all racks together. The screenshot shows the first option (the dynamics of power consumption in one of the phases).
This screenshot, in our opinion, is the most interesting for readers. Often, when communicating with customers, we hear about a lack of understanding of data center policies (including ours), which charge money for excess capacity, based on the factory (maximum or passport) capacity of the power unit, while the actual power consumption can be much lower!
Using this monitoring system allows you to track the actual power consumption of customers and to bill for overspending electricity based on actual performance. Working with large customers, we can move to a fully transparent system, providing
personalized access to the system for tracking statistics on the electricity consumption of its equipment.
Actually, that's all! Naturally, we could not describe all the functions of our system, but stopped at the most interesting. We hope that you liked the post. We are waiting for your questions and will definitely try to answer!
The monitoring system that is used to track TEL Hosting equipment is an in-house development of our company's specialists. The main diagram shows the location of server cabinets and temperature sensors located inside the containment area of our data center.
In this screenshot you can see that the temperature at different ends of our cold corridor is significantly different (21.9 and 23.6 degrees Celsius). This fact has a very simple explanation, on the left side of the corridor there is a perforated raised floor, here, at the moment, there are high-loaded blade systems and, in general, a high server installation density. In order not to consume electricity for cooling the rest of the corridor, in which the equipment has not yet been installed, our engineers decided to replace the perforated tile with airtight and close unused cabinets with plugs, reducing the useful volume of the cold corridor, and thereby increasing the efficiency of the cooling system.
')
If suddenly, the temperature on any of the sensors begins to deviate from the established range, the system will alert the engineers with a message to the e-mail and SMS to the mobile phone, which will allow the most promptly make the necessary corrections to the equipment.
Let us turn to another item that may be of interest to our potential customer. Calculation of energy consumption. In our system, we can choose any of the racks, and see its power consumption and other energy indicators, for example - the angle between the phase voltages. Each rack has two independent power inputs (Pilot 1, Pilot 2), which ensures uninterrupted operation of the equipment in case of emergency shutdown of one of the power inputs.
The plate shows the readings of the counters (electronic sensors) taken from 6 <blocks> (phases) into which each rack is divided. We can open the data for each meter and see more.
But we, as a consumer of electricity, are more interested in another tab. The system allows you to see in dynamics, for a period of time, as the power consumption for each phase, as well as the entire server cabinet or all racks together. The screenshot shows the first option (the dynamics of power consumption in one of the phases).
This screenshot, in our opinion, is the most interesting for readers. Often, when communicating with customers, we hear about a lack of understanding of data center policies (including ours), which charge money for excess capacity, based on the factory (maximum or passport) capacity of the power unit, while the actual power consumption can be much lower!
Using this monitoring system allows you to track the actual power consumption of customers and to bill for overspending electricity based on actual performance. Working with large customers, we can move to a fully transparent system, providing
personalized access to the system for tracking statistics on the electricity consumption of its equipment.
Actually, that's all! Naturally, we could not describe all the functions of our system, but stopped at the most interesting. We hope that you liked the post. We are waiting for your questions and will definitely try to answer!
Source: https://habr.com/ru/post/132219/
All Articles