Model for calculating the probability of crime
In the fiction film Minority Report, the action takes place in 2054 in the crime prevention section. Department staff receive information from three “visionaries”, whose visions are displayed on the screen. Future criminals are arrested even before he thought about the implementation of their plans.
Nowadays, this fantastic plot is partially embodied in reality, with one important difference: instead of “seers” information for police patrols is supplied by a mathematical model that calculates crime statistics in different parts of the city. The NY Times describes the work of police patrols in the city of Santa Cruz (California), where a similar crime prevention program works in an experimental mode.
Santa Cruz began testing the program in July 2011 on an array of data on property crimes (car theft and car theft, house robbery). It is assumed that the criminals tend to act in the usual areas of the city and at about the same time in which they had previously carried out successful robberies.

This graph displays statistics on gang fights in one of the areas of Los Angeles and serves to demonstrate that certain types of crimes tend to group together by time and place.
')
On the basis of crime statistics for the last few years, the lambda function λ (t) is calculated. This graph shows how crime statistics are converted to frequency.

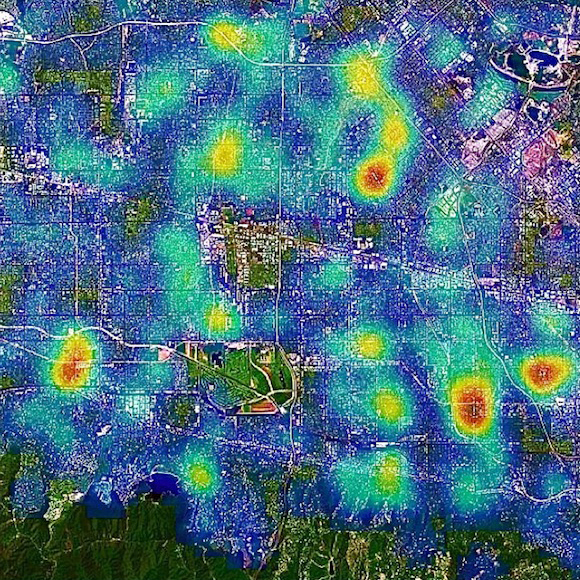
A similar parameter (crime rate) the program calculates for each district of the city and type of crime. If you make a heat map, you get something like the following.
The mathematical model is explained in more detail on the website of the University of Santa Clara, since the leading developer of the system is an employee of the university . In short, the model resembles the calculation of the likelihood of aftershocks - repeated seismic shocks, of lower intensity compared with the main shock. As in the case of earthquakes, each crime also creates waves of “aftershocks”, that is, they increase the likelihood of new crimes in the same place in the future. Although one process takes place in the earth's crust, and the other in human society, but oddly enough, similar formulas are used to describe them.
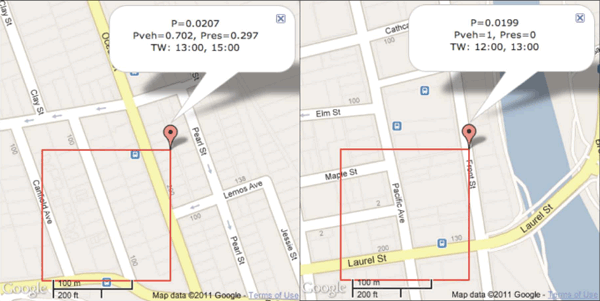
One way or another, but in the work of the patrol officers of Santa Cruz, almost nothing has changed, they do their job in the same way as before. Only every day they receive a new route for patrols, indicating 10 “hot spots” of the route. This is what this information looks like in the Google Maps interface.

For each square measuring 150 by 150 meters, the probability of committing a crime in a 24-hour period (P), the distribution of this probability by two types of crime are indicated: automobile (Pveh) and domestic (Pres), the start time of the two most dangerous hourly intervals (TW).
New data is added to the system every day. On the photo is the call center dispatcher 911, which maps the coordinates of crimes in real time.

According to the head of the police department of Santa Cruz, in the first month of testing, the system prevented several crimes and led to five arrests. The number of arrests, of course, is much less than the number of crimes prevented, because it is not always possible to prove malicious intent, but a potential attacker can be punished for another type of crime (for example, carrying a firearm or possession of drugs). For an effective law enforcement system, crime prevention is more important than catching a criminal. So, in July 2011, the number of robberies of cars decreased by 27% compared with the same month of 2010.
Increasing the efficiency of patrols, the program also saves taxpayers money, because because of the economic crisis in the police, Santa Cruz now has 20% fewer employees than in 2000. Now in the city with a population of 60,000 people there are only 94 police officers, including 60 patrolmen.
Incidentally, crime prediction departments are also being created in other US cities, although they do not give out direct instructions to patrol cars there. For example, last year the crime prediction unit was organized by the Chicago police.
Nowadays, this fantastic plot is partially embodied in reality, with one important difference: instead of “seers” information for police patrols is supplied by a mathematical model that calculates crime statistics in different parts of the city. The NY Times describes the work of police patrols in the city of Santa Cruz (California), where a similar crime prevention program works in an experimental mode.
Santa Cruz began testing the program in July 2011 on an array of data on property crimes (car theft and car theft, house robbery). It is assumed that the criminals tend to act in the usual areas of the city and at about the same time in which they had previously carried out successful robberies.
This graph displays statistics on gang fights in one of the areas of Los Angeles and serves to demonstrate that certain types of crimes tend to group together by time and place.
')
On the basis of crime statistics for the last few years, the lambda function λ (t) is calculated. This graph shows how crime statistics are converted to frequency.
A similar parameter (crime rate) the program calculates for each district of the city and type of crime. If you make a heat map, you get something like the following.
The mathematical model is explained in more detail on the website of the University of Santa Clara, since the leading developer of the system is an employee of the university . In short, the model resembles the calculation of the likelihood of aftershocks - repeated seismic shocks, of lower intensity compared with the main shock. As in the case of earthquakes, each crime also creates waves of “aftershocks”, that is, they increase the likelihood of new crimes in the same place in the future. Although one process takes place in the earth's crust, and the other in human society, but oddly enough, similar formulas are used to describe them.
One way or another, but in the work of the patrol officers of Santa Cruz, almost nothing has changed, they do their job in the same way as before. Only every day they receive a new route for patrols, indicating 10 “hot spots” of the route. This is what this information looks like in the Google Maps interface.
For each square measuring 150 by 150 meters, the probability of committing a crime in a 24-hour period (P), the distribution of this probability by two types of crime are indicated: automobile (Pveh) and domestic (Pres), the start time of the two most dangerous hourly intervals (TW).
New data is added to the system every day. On the photo is the call center dispatcher 911, which maps the coordinates of crimes in real time.
According to the head of the police department of Santa Cruz, in the first month of testing, the system prevented several crimes and led to five arrests. The number of arrests, of course, is much less than the number of crimes prevented, because it is not always possible to prove malicious intent, but a potential attacker can be punished for another type of crime (for example, carrying a firearm or possession of drugs). For an effective law enforcement system, crime prevention is more important than catching a criminal. So, in July 2011, the number of robberies of cars decreased by 27% compared with the same month of 2010.
Increasing the efficiency of patrols, the program also saves taxpayers money, because because of the economic crisis in the police, Santa Cruz now has 20% fewer employees than in 2000. Now in the city with a population of 60,000 people there are only 94 police officers, including 60 patrolmen.
Incidentally, crime prediction departments are also being created in other US cities, although they do not give out direct instructions to patrol cars there. For example, last year the crime prediction unit was organized by the Chicago police.
Source: https://habr.com/ru/post/132070/
All Articles