Using the event trace tool in Erlang
Here is one of the common problems of multi-threaded (concurrent) systems: events occur constantly in different parts of the program at different times, and you do not have the ability to control the cause and time of their occurrence. To track down a problem, we can often use a sequence diagram. For example, such (thanks to Wikipedia):
The purpose of this diagram is to show the interaction between the various parallel components of the system. In this example, Fred, Bob, Hank and Renee in a restaurant. Everyone can easily draw a similar chart on paper. The problem is that the sketches on paper may differ from what happens during the execution of your program.
')
Wouldn't it be great if you could build similar charts based on the program’s trace data automatically? Well, Erlang will help you with this. I will use some code to illustrate an example of how to do this.
The first step is to build a trace function. Mine looks like this and is located in the utp module.
The main idea is in the second function. This is a stub function with five arguments, which is immediately processed. The return value "hopefully_traced" is arbitrary, but it shows what we want to return from this function. The first function is used when we monitor outgoing and received events by the same component.
Argument Description:
When something important happens in the program, we call “utp: report_event / 5” (we substitute here the name of the trace function, which we declared in step 1). By default, this function will not do anything, but later we can catch it using the Erlang trace capabilities. Here is an example of the interaction described above:
Keep in mind that anything can be traced by calling this function in various places of your code. Instead of running multiple debugging blocks, you can add a call to the trace function anywhere in the program. Also note that I have a little shrunk the example above using a list generator, since I do not care about the level of detail of events and their contents.
Next, we need to call the "et" application in the correct way. I wrote the utp_filter module, which makes this call, despite the fact that it does not contain any filtering functions yet:
This module initializes et_viewer in such a way that it can be used with our example. The order of events - “event_ts” means that we add time stamps when events occur, not when they are received. The “actors” attribute sets the order in which the actors appear. The attribute "trace_pattern" is very important. It allows you to track the call “utp: report_event / 5”. You can also specify many other options, or the event will select them by itself. Do not specify the module in which the trace function is located.
If we call utp_filter: start ([]) by running et viewer described in step 3, we can run the trace test from step 2:
This should be similar to the Wikipedia example, except for what is obtained by tracing our program. In particular, this idea was used by me to capture and find bugs in variants of the uTP TCP stack:
(Despite the fact that the diagram is small, it still displays the basic idea - this example is not to show the diagram, but in order to gain worldwide fame :). For a TCP-like protocol, this is a very powerful tool: the output of tcpdump (1) and strace (1), as well as the internal state of the protocol on a single diagram. I found a few bugs with the help of these tools simply by viewing the interaction of the program.
It's all. With the above code, you can use a graphical tracer at any time. If you do not include it, the overhead of using the trace functions is insignificant, and if you turn it on, you can see how the code behaves in this situation.
Application (Application) - the term Erlang / OTP, in more detail
The purpose of this diagram is to show the interaction between the various parallel components of the system. In this example, Fred, Bob, Hank and Renee in a restaurant. Everyone can easily draw a similar chart on paper. The problem is that the sketches on paper may differ from what happens during the execution of your program.
')
Wouldn't it be great if you could build similar charts based on the program’s trace data automatically? Well, Erlang will help you with this. I will use some code to illustrate an example of how to do this.
Step 1. Build the trace function
The first step is to build a trace function. Mine looks like this and is located in the utp module.
report_event(DetailLevel, FromTo, Label, Contents) -> %% NB External call ?MODULE:report_event(DetailLevel, FromTo, FromTo, Label, Contents). report_event(_DetailLevel, _From, _To, _Label, _Contents) -> hopefully_traced. The main idea is in the second function. This is a stub function with five arguments, which is immediately processed. The return value "hopefully_traced" is arbitrary, but it shows what we want to return from this function. The first function is used when we monitor outgoing and received events by the same component.
Argument Description:
- DetailLevel: a number from 0 to 100. It indicates the significance level of this event. By assigning smaller events to major events, and larger numbers to less significant ones, we enable the tracer to hide some of the events, thereby achieving the desired level of granularity.
- From: event source.
- To: to whom the event is intended.
- Label: notation label of the message.
- Contents: what will be displayed when clicking on an event. It can provide more detailed information about the event without cluttering the chart.
Step 2. Trace the events in the program
When something important happens in the program, we call “utp: report_event / 5” (we substitute here the name of the trace function, which we declared in step 1). By default, this function will not do anything, but later we can catch it using the Erlang trace capabilities. Here is an example of the interaction described above:
trace_test() -> Events = [{fred, bob, order_food}, {bob, hank, order_food}, {bob, fred, serve_wine}, {hank, bob, pickup}, {bob, fred, serve_feed}, {fred, renee, pay}], [utp:report_event(50, F, T, L, []) || {F,T,L} <- Events]. Keep in mind that anything can be traced by calling this function in various places of your code. Instead of running multiple debugging blocks, you can add a call to the trace function anywhere in the program. Also note that I have a little shrunk the example above using a list generator, since I do not care about the level of detail of events and their contents.
Step 3. Call the application "et"
Next, we need to call the "et" application in the correct way. I wrote the utp_filter module, which makes this call, despite the fact that it does not contain any filtering functions yet:
start(ExtraOptions) -> Options = [{event_order, event_ts}, {scale, 2}, {max_actors, 10}, {detail_level, 90}, {actors, [fred, bob, hank, renee]}, {trace_pattern, {utp, max}}, {trace_global, true}, {title, "uTP tracer"} | ExtraOptions], et_viewer:start(Options). This module initializes et_viewer in such a way that it can be used with our example. The order of events - “event_ts” means that we add time stamps when events occur, not when they are received. The “actors” attribute sets the order in which the actors appear. The attribute "trace_pattern" is very important. It allows you to track the call “utp: report_event / 5”. You can also specify many other options, or the event will select them by itself. Do not specify the module in which the trace function is located.
Step 4. Testing
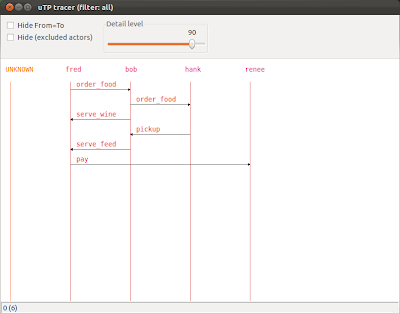
If we call utp_filter: start ([]) by running et viewer described in step 3, we can run the trace test from step 2:
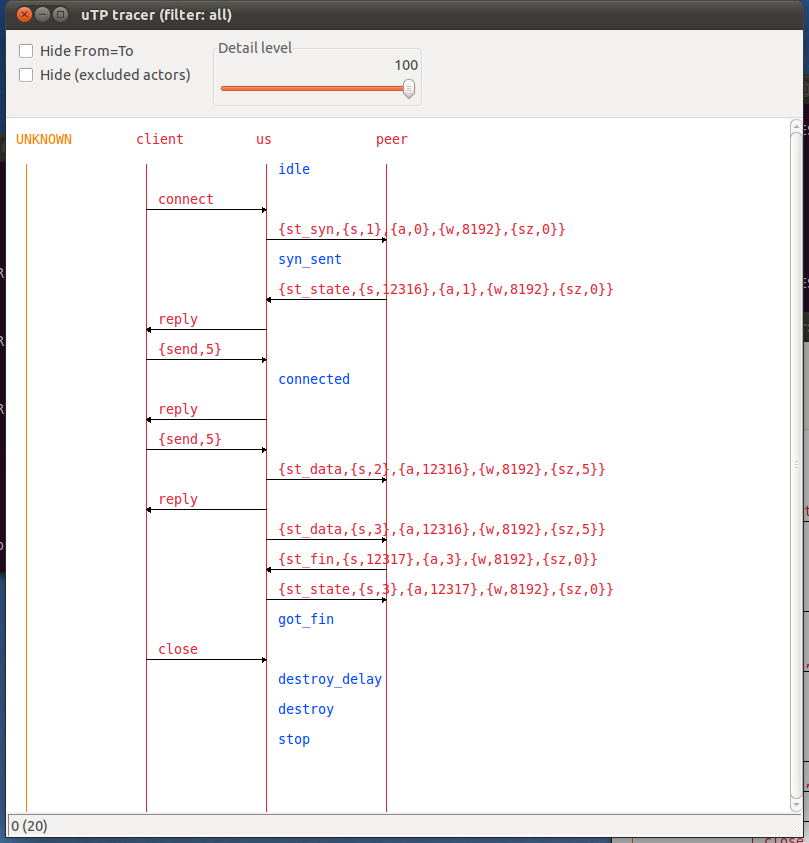
This should be similar to the Wikipedia example, except for what is obtained by tracing our program. In particular, this idea was used by me to capture and find bugs in variants of the uTP TCP stack:
(Despite the fact that the diagram is small, it still displays the basic idea - this example is not to show the diagram, but in order to gain worldwide fame :). For a TCP-like protocol, this is a very powerful tool: the output of tcpdump (1) and strace (1), as well as the internal state of the protocol on a single diagram. I found a few bugs with the help of these tools simply by viewing the interaction of the program.
It's all. With the above code, you can use a graphical tracer at any time. If you do not include it, the overhead of using the trace functions is insignificant, and if you turn it on, you can see how the code behaves in this situation.
Application (Application) - the term Erlang / OTP, in more detail
Source: https://habr.com/ru/post/131140/
All Articles