Study: 20% of game developers for the App Store receive 97% of all money

On September 19, I launched a survey among developers of games for iOS in order to get statistics on incomes of the largest possible number of them. The task was to create a realistic picture of the current state of the market and share this information with the community. I was led to this by an abundance of articles describing the situation in the extremes: “The developer made millions on iOS games!” Or “The game earned $ 0 on the App Store”.
With the thought of getting an objective state of affairs, on September 19, 2011, I launched a seven-day survey, in which 252 developers took part.
However, before sharing the data, a few words about the methodology and errors.
')
Methodology
The study was conducted using the online service SurveyMonkey and consisted of 8 questions. The first two of them were about the type of developer and the number of people in the team. The next three questions were about games released by the developer for all the time and how much profit they brought. The last three questions are about games released in the last 12 months.
A proposal to participate in the study was posted on the following resources:
- Google+
- 148Apps.biz
- TouchArcade forums
- iPhoneDevSDK forums
- forums cocos2d
- Unity forums
The goal was to attract as many active game developers for iOS as possible. The study ended on September 26, 2011 at midnight. It is also worth noting that before the survey, I promised that:
- research will not collect any personal data
- data will be presented in aggregate, “raw” data will not be published
Errors and errors
Note: I do not claim the statistical accuracy of the data presented. There is a possibility that the sample is not representative, or that I unconsciously introduced an error in the results in the way I formulated the questions. I am not a professional statistician, so do not consider this data as the ultimate truth. A little more about this below.
Sample
Since the study was completely voluntary, and I do not have information about the demographics of iOS developers, I cannot, as I have already noted, assess the representativeness of the sample. In addition, because of the way I collected the data, the developers who took part in the survey are active members of the community and are actively working on the games. Therefore, there is reason to assume that the numbers that we see here are somewhat higher than in the App Store as a whole. However, I do not have data confirming or refuting this conjecture.
12 months data
One of the things I wanted to know was how the last 12 months looked to game developers on the App Store. However, the questions that I formulated confused respondents a little. I intended to find out how much the games that were released in the last 12 months earned, but many developers provided a profit from all of their games in the 12 months, regardless of when they were released. This made the data unusable for the purposes I originally intended. In addition, many people did not understand the instructions for the two questions, where it was necessary to separately indicate the profit from direct sales and non-operating income. As you will see, I did get some statistics, but not all that I planned.
Other
There are, no doubt, other sources of errors and errors in the data. The main thing to remember that these figures are not 100% accurate, but, nevertheless, give an idea of the game market for the App Store.
results
The survey was conducted 7 days, 252 developers took part.
General issues
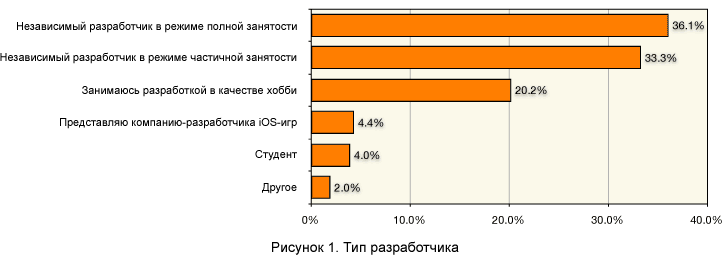
The first 2 questions were intended to get general information about the respondent.
As can be seen from Figure 1, only of respondents work in full-time mode. Slightly more than half work either part-time, or make games as a hobby, or students.
When asked how many people are in a team, half of the respondents answered that they work on themselves. The surprise was to find out the percentage of people working for a company of 10 people or more in size. However, 93% of respondents work in a team of 5 or less people (see Figure 2).

Profit for all time
The following 3 questions related to information about the number of games and profits from them for all time:
- number of games from the developer on the App Store
- how long have these games been placed on the app store
- profit from all games for all time
Using this data you can get interesting results. First, let's look at the profit for all time (Figure 3). One of the interesting observations is the exponential nature of the graph. It clearly shows that most developers do not get a lot of money selling games on the App Store, and at the same time a small amount makes great money.
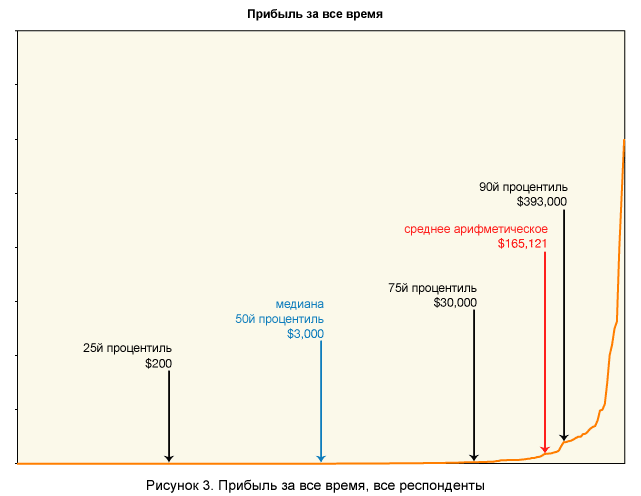
I marked on the graph the arithmetic mean and the median . The median is important because The extremely high incomes of a small number of developers significantly reject the value of the arithmetic average, looking at which it can be mistakenly concluded that the average developer's profit is $ 165,000. The median is evidence of something else. It divides developers into two equal parts, and we see that the profit of 50% of developers is less than $ 3000, while the other 50% earned more than this amount. The reason the arithmetic mean and median differ so much is that the standard deviation is 639.966. Such a high value indicates that the arithmetic average is not representative in our situation. Therefore, in the future I will use the median in the graphs.
Also on the graph you can observe, for example, that if you were in the 75th percentile, you would have earned about $ 30,000. This means that only 25% of developers have earned more than $ 30,000 for all time. Similarly, we see that the profit of 25% of developers was less than $ 200.
Let's look at Figure 4. Note that the horizontal axis uses a logarithmic scale instead of a linear scale. The income data is divided into groups (each subsequent group is 10 times the previous one). The graph shows that about 25% of developers earned from $ 1,000 to $ 10,000 in the App Store. What is impressive, 4% of respondents (10 respondents) earned more than $ 1,000,000 in earnings!
Note: in Figure 4, you can see duplication at the boundaries of the ranges (eg 1-10, 10-100, etc.). This is done only for inscriptions to make them easier to read. In fact, the data are divided into groups (10n) - (10n + 1 - 1), i.e. 1-9, 10-99, etc.

The 4% of millionaires mentioned above made me think about the ratio of incomes distributed among developers. Those. what percentage of profit belongs to what percentage of developers (see Figure 5). I was surprised to find that 97% of all profits from the sale of games on the App Store belong to 20% of the developers. And more than ⅓ of all the money goes to the top 1% of developers. The bottom 80% of game developers get only 3% of the profits.

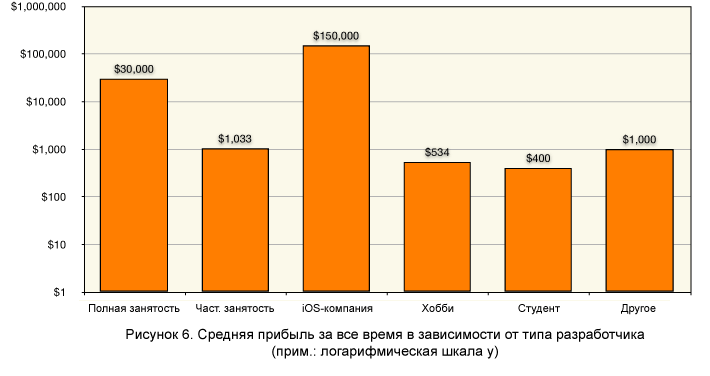
Next, I decided to trace the dependence of the amount of earnings on the type of developer (see Figure 6). The vertical axis shows the median profit for all time. As expected, developers for whom mobile games are the main source of income and developers representing companies specializing in iOS development earn more. Please note that the vertical scale is logarithmic, the difference between the first and second bars is 30 times. This does not mean that if you switch from part-time to full-time employment, then you will start earning 30 times more, but nevertheless, the data received from respondents are as follows.
Next, I wanted to know the dependence of the profit figures on the number of people in a team (see Figure 7). Again, the vertical scale is logarithmic.
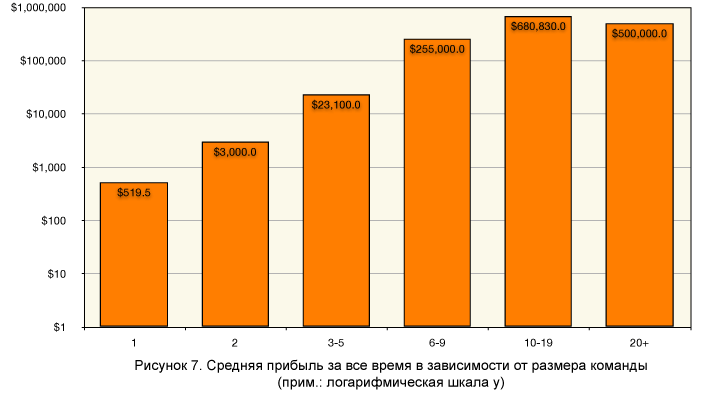
Note: the median profit of companies with 10 or more people may not be entirely accurate due to the small number of respondents in this category . Nevertheless, it is clear that loners on average earn the least.
But then I suggested that larger teams could simply release more games and thereby earn more profit. To test this, I divided the profit by the number of games released and by the number of months during which the developer sells games on the App Store.
Figure 7b shows the dependence of the median of profit per month per game on the number of people in a team.

As you can see, the type of graphics has not actually changed compared to Figure 7. From this we can conclude that games created by teams, as a rule, bring more profit than games created by singles. I suppose that this is due to the fact that the former create more technically interesting and more developed games due to the number of people involved in the process of improving the game.
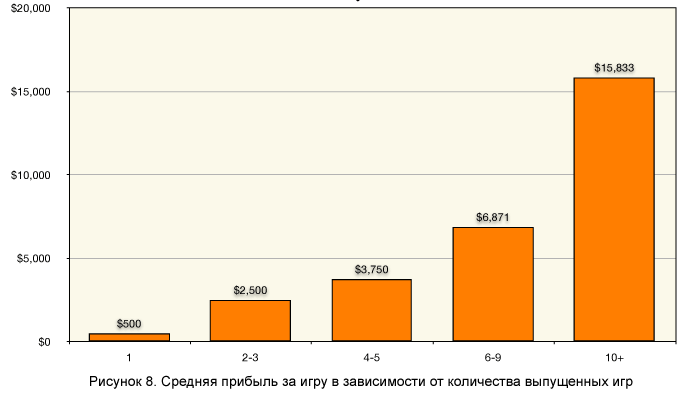
Finally, it was interesting to find out whether the profits from each new game increase as the developer becomes more experienced. Trying to answer this question, I divided for each developer his profit for all time by the number of games, then I calculated the median depending on the number of games released (see Figure 8). There is a tendency that, over time, produced games on average earn more than previous ones. This should encourage you if your first game fails. Do not worry, because 50% of developers from their first game earned less than $ 500. But, as a rule, the more games they released, the greater the profit from each new game. As they say, perseverance and work will be a bit complicated.
Profit in the last 12 months
From the answers to the last 3 questions it was supposed to receive information on profits from the applications that were released in the last 12 months. However, since many respondents provided profits for the past 12 months from all their games, regardless of the release date, I could not draw all the conclusions that I originally wanted. Nevertheless, I did get some information.
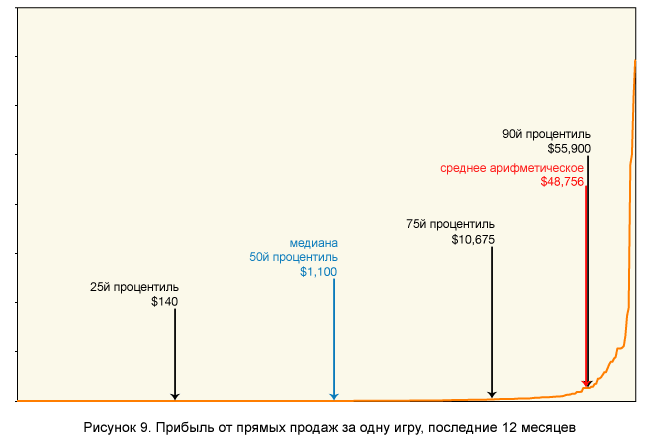
In Figure 9, we see a graph of profits from each individual game over the past 12 months. 382 games were counted, which brought profit through direct sales (including In-App Purchases). It can be seen that the curve of the graph is similar to the graph of sales for all time, it is also exponential. And again we see a significant difference between the arithmetic mean and the median.
It can be observed that the average game has earned $ 1,100 in the last 12 months. This means that 50% of the games brought more than this amount to their creators, and 50% less. 25% of games earned less than $ 140, and 25% more than $ 10,675.
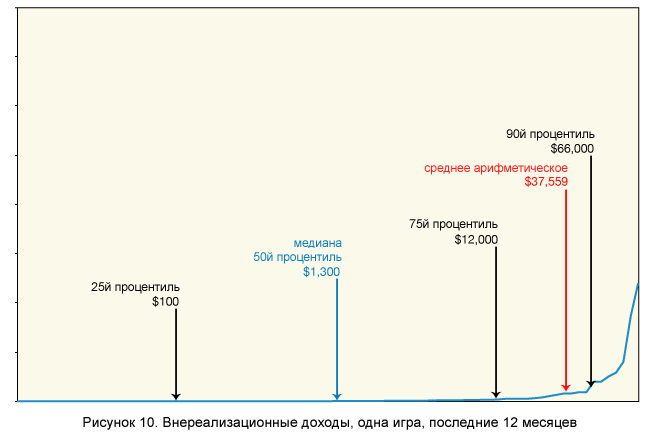
Finally, Figure 10 shows the non-operating profit gained from 85 games. This refers to profits from advertising, affiliate links, sales of side products, etc. It is clearly seen that the numbers in the extreme right area are significantly lower than in the previous graph. However, in the middle of the chart, the figures even slightly exceed the corresponding amounts received from direct sales.
This means that such things as advertising, affiliate links and the use of other methods of obtaining non-realized income can make good money than some developers have successfully used.
Conclusion
Phew! I had to process a large amount of data and thanks for reading this until that moment. I apologize for not being able to get more accurate data regarding the last 12 months, I had to formulate questions differently.
Hopefully, the results have shed some light on the game development market for the App Store and will be useful for both novice and more experienced igrodelyam. Obviously, big money can still be earned, although it is not easy. As the statistics confirm, the more games you make, the better you get. And finally, I want to thank all those who participated in this study.
Source: https://habr.com/ru/post/129547/
All Articles