Testing the trading system in PHP
Introduction
Probably everyone who has come up against trading stocks, currencies or some other exchange instrument often met with advice on the need to build and test their trading system.
Trading in the system seemed to me the only right way to work on the stock exchange, and I decided to use the advice and test my trading strategy.
')

At the same time, I decided to combine business with pleasure and implement the testing of a trading strategy in PHP. Why I did not use ready-made software products like TSLab , WealthLab , etc.? Firstly, the very task of implementing a trading robot is quite interesting as self-development. Secondly, most products for testing trading strategies are paid, and no one can guarantee that free analogues will not soon change their distribution policy. Also, I am not sure that the capabilities of third-party products will be enough for my future trading strategies. Thirdly, PHP is a web-oriented language, and you can then use your development as the main module for a web service. Already these three reasons were enough for me to start working on the tradeSystem.
I’ll just make a reservation that I developed the project primarily for myself, and at this stage many will be interested not so much from a practical point of view, but from an academic point of view due to the small set of implemented indicators, insufficient testing of various use cases, the presence of documentation in the form of tests and other nuances . The project is open-source, so if you find the practical application of this development appropriate, follow the expansion and testing functionality.
Strategy formalization
Our strategy will be essentially a “hello world” strategy. It will be based on the MACD histogram .
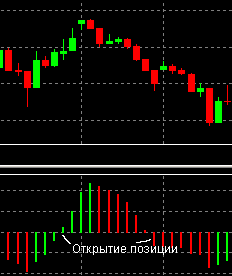
It is believed that when the graph of this indicator crosses the value “0” above or below, this signals a change in trend. If the intersection occurs from top to bottom - a sell signal is received, if from the bottom up - a buy signal.
Our strategy will work on the hourly chart and at the end of each hour will check if there is a sell or buy signal. The signal will be the difference in signs between the current and the previous value of the indicator, or the zero value of the previous value of the indicator. In the case of a signal and the absence of paper in the portfolio, we will open a position on all the money that we have in stock. When opening a position, we will place a stop loss order at the level of 1% of the opening price of the position and take profit order at the level of 2% of the opening price, with an offset of 0.4 points from the maximum.
We would also like to take into account the commission that the broker will take at the beginning of each day.
In the end, according to the results of testing, we want to get the total amount on the balance sheet, information about the maximum winning and losing in a row and the log of operations that were performed during testing.
Implementation of the trading system and testing script
Before we start developing our strategy, let's install tradeSystem. The installation process is not particularly difficult and is described in the project wiki .
Directly for testing, we need three components: the data of quotations, the implementation of the trading system, and the script that organizes the test environment and the output of information about the operation of the system.
As for these quotes, I used the export of quotes from the Finam broker website. I decided to test the system at Sberbank's 2011 quotes. Despite the fact that the trading strategy makes decisions on the hourly chart, we will need to submit the minute chart data to the input. To save the broker's site, I put the quotes file in the robots / testing / input directory of the project under the name: SBER_110101_111231_1min.txt.gz. Just unpack this file, preferably in the same directory where it lies.
Next, we need to implement a direct trading strategy. You can see the listing of the final code by opening the MACDHistogrammReverseStrategy.class.php file. Class code should be fairly clear, I will only comment on general words.
For our strategy, we need the indicator itself, on the basis of which it works, the paper we are testing and the counter of the series of winnings and losses. Next, the strategy should have a handleBar method, the argument of which is a candle. For convenience, I highlighted two more methods: canOpenPosition and openPosition, which are directly responsible for checking the possibility of opening a position and directly about opening a position.
In the simpleHandle function, we check whether the time has come to make a decision, if it has come, we check whether a signal has appeared to buy or sell. If you appear - open the position. In the openPosition function, we directly open a position, set stop loss and take profit orders. Since these orders are also essentially a position tracking strategy, we insert the insertUp method into the strategy call chain. That's all, it remains only to write a script that will read the data quotes, and submit them to the input strategy.
Test script
The listing of the script can be seen in the file MACDHistogrammReverse.php . The code should be clear enough again, I will highlight the main points.
After checking whether the file name with the input data is transferred, you need to connect the init file that is responsible for initializing the working environment and calling the classesAutoloaderInit function, which initializes the class autoloader.
Then we need to prepare our indicator, which we will pass on strategies. It is known that the MACD histogram is built on the basis of other indicators, so we first create the basic indicators, and gradually we reach the indicator we need.
We will assign the calculation of the new indicator values to the Chart class. To do this, create it and add all our indicators to it. Now, when calling the handleBar Chart, it will cause all indicators to calculate the new indicator value. Some questions may arise regarding the need for EndStrategy and BeginStrategy, which are wrapped in our strategy. The main purpose of these strategies is to ensure that the newly generated strategies are correctly processed by strategies that are located in the chain itself. For example, with the insertUp method that uses our strategy, the TakeProfit and StopLoss strategies are inserted up the chain, but after BeginStrategy. In the absence of BeginStrategy, a situation may arise when we call the handleBar of our strategy, and the strategies upstream would generally be left out of testing.
Then everything is quite simple, we create our strategy, create an object that will deduct a commission, start reading input data with FinamBarReader and submit it to commission input, graphics and strategies. Also, do not forget to update the current time in the DateTimeManager, so that our strategy correctly processes the point in time at which a decision must be made.
In the end, if we have an open position - we close it forcibly at the price of the last transaction and with the final chord we display information that interests us.
We are testing
At the entrance we will submit the minute data. Despite the fact that the strategy makes decisions on the hourly chart, we need to test on the minute chart because of the strategy TakeProfit. This strategy has only candles at the entrance, and should work on waiting for the worst movement for it quotes, which is the movement from the maximum to the minimum of the candle, and vice versa. For an hour candle, this would mean too frequent false triggering, which in reality might not be. Therefore, we should try to take as little as possible the period of candles for testing the strategy, in this case the movement of quotes within an hour will be more accurate, and the strategies work more close to reality.
So, we are testing:
php robots/testing/MACDHistogrammReverse.php robots/testing/input/SBER_110101_111231_1min.txt > /tmp/result.txtWe look at the result.txt file and see that according to the results of testing our strategy showed four wins in a row, six losses, and in the end we have 9143 rubles left on the account, with an initial balance of 10,000 rubles. Total trading system conducted operations in the amount of 2 million rubles.
For clarity, I made a graph of the balance in time.
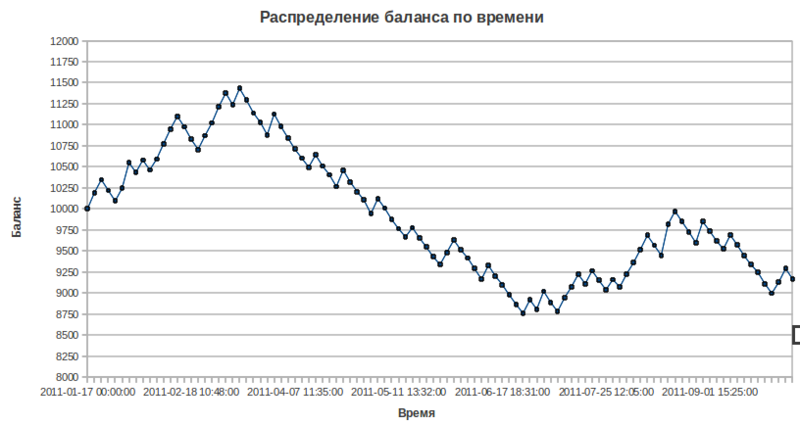
It clearly shows the behavior of the system. Basically, the system makes a series of losing trades, which is interrupted by a profitable trade. But at the same time it is clear that the profit from the transaction cannot cover the losses from the previous series of losing trades.
Well, we at least lost a little, which is also good. However, it is believed that in real trading the results of trading strategies will be slightly worse than in testing, therefore, we can assume that the strategy will lose. If we still take into account the broker's monthly commissions, which we did not take into account when testing our products, and the commission for transferring margin transactions, the strategy clearly needs to be either replaced or refined.
This is probably all. If anyone was interested, join the project on github , ask questions, share your developments and test your trading strategies before working on them on a real account, this will save your savings and nerves.

Source: https://habr.com/ru/post/129489/
All Articles