Creating graphs with javascript
 With the beginning of the existence of HTML 5, web application capabilities in browsers have increased fantastically. One example is the canvas element, which allows, using JavaScript, to draw 2D and 3D models, as well as raster graphics (bitmaps).
Thanks to these features, statistical graphs can be drawn directly in the browser. Types of graphs may be different. In the past, various approaches were used to depict a graph. If the appearance of the graphic allowed, standard HTML and CSS were used. However, approaches for more complex graphs used various technologies embedded in browsers HTML, CSS and JavaScript. Popular was the use of Flash, or the graphics were drawn on the server, with the subsequent transfer of their image to the client. These approaches took a lot of time to support, broke the consistency of the applications, forced the client to install additional software and additionally loaded the server.
The main disadvantage of using canvas and JavaScript is the different support [1] browsers and the complete lack of support in older versions.
When implementing graphs, the stage of transmitting statistical data is very important. One of the possible scenarios is to directly receive the JS file from the server, which contains arrays of statistical data. Such an approach would be absolutely sufficient if this data would be used only by JavaScript applications.
')
But, when the data requires independence from a particular application, you need to use a different approach. In our case, we use JSON [2] . JSON is easy to understand JavaScript, and its syntax makes it easy to implement a full parser.
Source github
JavaScript has a built-in parser for JSON. The ECMA-262-5 standard included JSON.parse , which is implemented in the latest browser versions. In older versions of browsers, you can use json [3] from Douglas Crockford. Contrary to the fact that the Douglas Crockford parser is not fully compatible with JSON.parse in ECMA-262-5, it is quite reliable in contrast to the direct use of eval.
After the data has been processed and ready for use by the application, the plotting is followed. In this case, the approaches differ according to the type of schedule. In our case, we will draw a graph with columns. We will use the API for the text for canvas, and also draw a legend to the graphic.
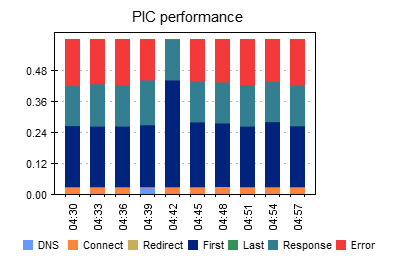
We use these charts in WebSitePulse Current Status an extension for Google Chrome. Add-on allows you to monitor your servers while using your favorite browser. Statistical graph will show you stability in a certain period of time.
You can try WebSitePulse Current Status with the following settings:
Username: wspdemo
API Key: 35e6340814655582a79039dbc1cb0b65- Canvas support in browsers - caniuse.com/#search=canvas
- JavaScript Object Notation - www.json.org
- json - github.com/douglascrockford/JSON-js/blob/master/json.js
Source: https://habr.com/ru/post/129329/
All Articles