Markov networks (MRF) on the example of "smart" segmentation
Introduction
 Colleague Bo_bda talks about the fundamental problems of image processing and analysis. Well, I can not stay on the side and not share my experience. Today I will tell you about such an entertaining thing as Markov networks (markov random fields in foreign literature). This mathematical model is used to solve almost all graphics processing tasks (here you will also need segmentation, image restoration, stereo imaging, various issues in 3D, and much more).
Attention! Under the cat tons of pictures (in a blog about graphics, something for what it is).
Formulation of the problem
 As a rule, there are 2 types of tasks: direct and inverse. For example, in computer graphics, a direct problem is often solved: at the input we deliver a set of light sources, environmental parameters, and at the output we get a scene model. In computer vision, everything is accurate, but on the contrary - we feed a set of images to find out where they are interested in something (in machine learning there is a concept with a very similar meaning - regression ). More formally, the task can be defined as follows: for a given set of values, it is necessary to calculate the parameters of some unknown model.
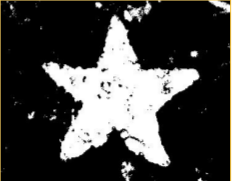
To be concrete, we will try to solve the following problem: select the starfish entirely in the picture above, provided that we can mark the object we need (red strokes) and everything else (blue).
Theoretical background
So, with strokes, we marked an arbitrary set of points that satisfies a certain condition.
The statistical conclusion is to obtain information about the entire sample based on its part ( wiki ). There are 2 main approaches - frequency and Bayesian. We will use the latter, since it is operated with a very interesting and useful concept for us - a prior probability.
The a priori probability distribution of a certain quantity p is the probability distribution, which expresses assumptions about p before taking into account the experimental data ( wiki ). Do not find that very suitable to our conditions? :)
The likelihood function in mathematical statistics is the joint distribution of a sample from a parametric distribution, considered as a function of a parameter ( wiki ).
An a posteriori maximum estimate (maximum a posteriori - MAP) allows one to calculate a certain value using an a priori probability distribution ( wiki ).
Closer to the point
The transformation we seek can be described as follows:
 where
where')
P (x | z) is the posterior probability ( wiki );
P (z | x) is the likelihood function (depends on the data, ie, the current image);
P (x) - a priori probability (independent of the data).
In fact, the problem of finding a better division can be formulated as follows:
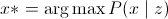 (it is a formula and expresses MAP), or, which is the same
 where
whereE (x) is the image energy.
Consider each part separately.
Credibility function
 This function with x = 0 or x = 1 indicates whether the current pixel z belongs to the desired image area. In the picture on the right you can see it.
To improve the result, we need to find the maximum:

The result should be the following:
Prior probability
This parameter allows to take into account neighboring pixels during segmentation. Connect the current pixel with its neighbors vertically and horizontally. Then:
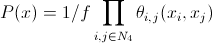 where
where 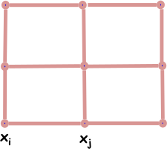
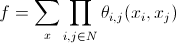 - separation function;
 - “Ising prior” (a priori Ising probability, at the prompt yuriv ).
In this case, all

A posteriori probability
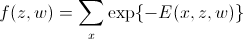
In determining this term, we use the Gibbs distribution ( wiki ):
 where
where - image energy, where the first term is the energy value of the current pixel itself, and the second is the total value with the neighbor; w - a certain weight, the value of which is determined experimentally;
 - the likelihood function;
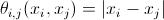 - a priori probability.
Fuh, it remains quite a bit, the most important thing.
Energy minimization
As we established at the very beginning, the minimum energy corresponds to the MAP. In this case:

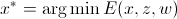 (desired minimum energy)
results
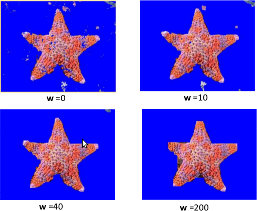
“What was it and, most importantly, WHY ?!”, the reader will ask. This is what can end up with the indication of different values of weight w:
findings
The special charm of this method lies in the fact that we can set any energy formulas. For example, you can achieve a selection on the image of exclusively straight lines, the intersection points of a certain number of straight lines / curves, and more. By the way, any lucky owner of MS Office 2010 can feel the technology described. It is enough to use the Background Removal tool.
Thanks for attention!
Copywriter corner
All used images are taken from the works of Carsten Rother. Formulas are built using the online interpreter Latex .
List of serious literature
- Works Carsten Rother
- The book Richard Szeliski "Computer Vision: Algorithms and Applications"
Source: https://habr.com/ru/post/129070/
All Articles