2GIS launches beta service of traffic jams
The 2GIS maps now have information about the state of the road. The 2GIS Traffic Jams service shows the current speed of traffic, road sections are indicated by three colors depending on the degree of congestion: red if there is a traffic jam (traffic is slower than 20 km / h), yellow if movement is difficult (from 20 to 40 km / h) , green - if nothing prevents the passage and cars go faster than 40 km / h. Data is updated every 5 minutes.

The new service is still in beta testing mode and is available only in the online version of Novosibirsk's 2GIS , but in the future it will work in other cities, especially where the traffic jam situation is particularly relevant.
Currently, the 2GIS Jam traffic information on the state of traffic in Novosibirsk is obtained from a partner company engaged in monitoring vehicles — data on the movement of almost 1,200 cars equipped with GPS trackers. In the near future, the mobile version of 2GIS can also become a source of information about the traffic situation.
')
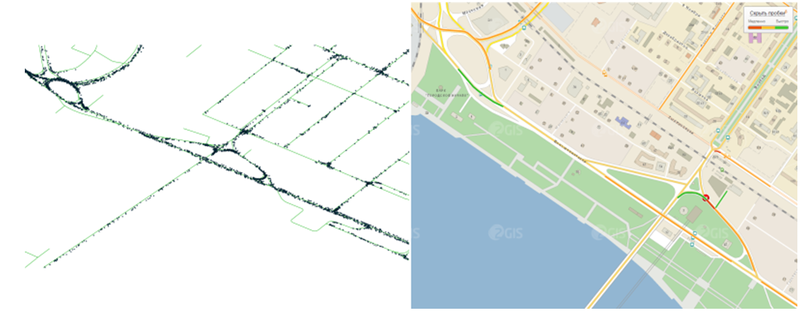
Communal bridge and Rechnoy Vokzal in Novosibirsk through the eyes of the 2GIS Jam analysis service and the user of the 2GIS online version
The peculiarity of the 2GIS Traffic jams service is the work based on the exact graph of roads. At the launch of each new city, maps created on the basis of satellite images are verified by GIS specialists directly into the “field”. In the future, we constantly monitor not only changes in the company's reference data, but everything related to cartography, including changes in the road network.
In the future, “2GIS Traffic jams” will take into account the relative state of the traffic, since 20 km / h is already a traffic jam for highways and normal speed for a narrow street in the center. In addition, the priority plans include the ability to view the “Traffic jams” layer in the mobile version of 2GIS, and later on in 2GIS for PC.
The new service is still in beta testing mode and is available only in the online version of Novosibirsk's 2GIS , but in the future it will work in other cities, especially where the traffic jam situation is particularly relevant.
Currently, the 2GIS Jam traffic information on the state of traffic in Novosibirsk is obtained from a partner company engaged in monitoring vehicles — data on the movement of almost 1,200 cars equipped with GPS trackers. In the near future, the mobile version of 2GIS can also become a source of information about the traffic situation.
')
Communal bridge and Rechnoy Vokzal in Novosibirsk through the eyes of the 2GIS Jam analysis service and the user of the 2GIS online version
The peculiarity of the 2GIS Traffic jams service is the work based on the exact graph of roads. At the launch of each new city, maps created on the basis of satellite images are verified by GIS specialists directly into the “field”. In the future, we constantly monitor not only changes in the company's reference data, but everything related to cartography, including changes in the road network.
In the future, “2GIS Traffic jams” will take into account the relative state of the traffic, since 20 km / h is already a traffic jam for highways and normal speed for a narrow street in the center. In addition, the priority plans include the ability to view the “Traffic jams” layer in the mobile version of 2GIS, and later on in 2GIS for PC.
Source: https://habr.com/ru/post/128764/
All Articles