Automatic software testing
Introduction
For a long time, it was believed that dynamic program analysis is too heavy an approach to detecting software defects, and the results do not justify the effort and resources expended. However, two important trends in the development of the modern software industry allow us to take a fresh look at this problem. On the one hand, with a constant increase in the volume and complexity of the software, any automatic error detection and quality control tools can be useful and in demand. On the other hand, the continuous increase in the productivity of modern computing systems makes it possible to effectively solve increasingly complex computational problems. Recent research in the field of dynamic analysis, such as SAGE , KLEE and Avalanche , demonstrate that despite the inherent complexity of this approach, its use is justified, at least for some class of programs.
Dynamic vs Static Analysis
Static analysis is often considered as a more effective alternative to dynamic analysis. In the case of static analysis, the search for possible errors is carried out without launching the program under study, for example, from the source code of the application. Usually, an abstract model of the program is built, which, in fact, is the object of analysis.
The following characteristic features of static analysis should be emphasized:
- Separate analysis of individual fragments of a program (usually individual functions or procedures) is possible, which provides a reasonably effective way of dealing with the non-linear increase in the complexity of analysis.
- False positives are possible, either due to the fact that some details are ignored in the construction of an abstract model, or because the analysis of the model is not exhaustive.
- When a defect is detected, firstly, the problem of checking the truth of the detected defect ( false positive ) and, secondly, the problem of reproducing the found defect when the program is run on certain input data.
Unlike static analysis, dynamic analysis is performed while the program is running. Wherein:
- To run the program requires some input.
- Dynamic analysis detects defects only on the track defined by specific input data; defects located in other parts of the program will not be detected.
- In most implementations, the occurrence of false positives is excluded, since error detection occurs at the moment of its occurrence in the program; Thus, the detected error is not a prediction made on the basis of the analysis of the program model, but a statement of the fact of its occurrence.
Application
Automated testing is primarily intended for programs for which performance and security with any input data are the most important priorities: web server, SSH client / server, sandboxing, network protocols.
')
Fuzz testing (fuzzing)
Fuzzing is a testing technique in which non - valid , unintended or random data is input to a program.
The main idea of this approach is to randomly “mutate”, i.e. change the expected input data in arbitrary places. All fuzzers work in approximately the same way, allowing you to set some constraints on the mutation of input data by certain bytes or a sequence of bytes. As an example, we can mention: zzuf (linux) , minifuzz (Windows), filefuzz (Windows). Protocol phasers: PROTOS (WAP, HTTP-reply, LDAP, SNMP, SIP) (Java) , SPIKE (linux) . Fuzzing frameworks: Sulley (framework for creating complex data structures) .
Fuzz testing - the forerunner of automatic testing, the method of “brute force”. Of the advantages of this approach, only its simplicity stands out. The obvious disadvantage is that Fazzer knows nothing about the program’s internal structure and, ultimately, to completely cover the code, he has to sort through an astronomical number of options (as you might guess, a full search grows exponentially from the size of the input data O (c ^ n), c> 1).
Phasers new generation (review)
The logical but not so simple continuation of the idea of automatic testing was the emergence of approaches and programs that allow to impose restrictions on mutable input data, taking into account the specifics of the program under study.
Tracking of tagged data in the program
The concept of symbolic or tainted data is introduced - data received by the program from an external source (standard input stream, files, environment variables, etc.). A common solution to this problem is to intercept a set of system calls: open, close, read, write, lseek (Avalanche, KLEE).
Code Instrumentation
The code of the program under study is reduced to a form suitable for analysis. For example, an internal hardware-independent representation of valgrind (Avalanche) is used, or the llvm bytecode of the program (KLEE), convenient for parsing, is analyzed.
The instrumented code makes it easy to find potentially dangerous instructions (for example, division by zero or dereferencing a null pointer) and their operands, as well as branch instructions that depend on the tagged data. Analyzing the instructions, the tool creates logical conditions for the tagged data and transmits a request for satisfiability to the “solver” of Boolean formulas ( SAT Solver ).
Solving Boolean constraints
SAT Solvers - solve the problems of the feasibility of Boolean formulas. They answer the question: is the given formula always fulfilled, and if not always, a set of values is given, on which it is false. The results of the work of such solvers are used by a wide range of analyzing programs, from theorem provers to genetic code analyzers in bioinformatics. Such programs are interesting in their own right and require separate consideration. Examples: STP , MiniSAT .
Simulation environment
In addition to intercepting system calls, analyzers need to formalize the task to automatically generate conditions for the “solver” of Boolean formulas. The input file, the set of registers and the address space (memory) of the program are represented using arrays of the Boolean “solver”.
Brute force in the program
Having received the answer from the “solver”, the tool receives a condition on the input data for inverting the conditional transition under study or finds out that it is always true or false. Each condition variant creates a new independent path in the program, and the program has to consider each path and the conditions for its execution independently, i.e. the paths are forged on each branch instruction depending on the input data. New input data can open previously unopened basic blocks of the program under study, and so on. For exhaustive testing, a complete search of all possible paths in the program is necessary. Since the growth rate of the number of paths has decreased significantly compared with the brute force method (~ O (2 ^ n), where n is the number of conditional transitions depending on the input data), but still remains significant. Analyzers are forced to use different heuristics to prioritize the analysis of certain paths. In particular, there is a distinction between the choice of the path covering the largest number of uncovered (new) basic blocks (Avalanche, KLEE) and the choice of a random path (KLEE).
Avalche
Avalanche is a software defect detection tool using dynamic analysis. Avalanche uses the program’s dynamic instrumentation capabilities provided by Valgrind to collect and analyze the program execution path. The result of this analysis is either a set of input data on which an error occurs in the program, or a set of new test data, which allows you to bypass the previously unfulfilled and, accordingly, not yet verified program fragments. Thus, having a single set of test data, Avalanche implements an iterative dynamic analysis in which the program is repeatedly executed on various automatically generated test data, with each new launch increasing the coverage of the program code with such tests.
General scheme of work
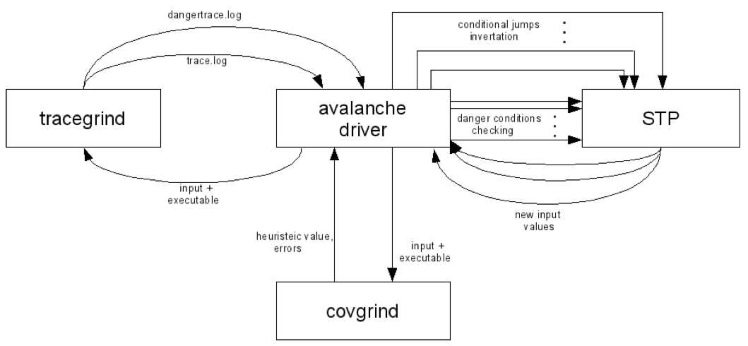
The Avalanche tool consists of 4 main components: two Valgrind expansion modules (plug-ins) - Tracegrind and Covgrind , an STP constraint checking tool and a control module.
Tracegrind dynamically monitors the flow of tagged data in the analyzed program and collects conditions for bypassing its uncompleted parts and for triggering dangerous operations. These conditions are transmitted by the control module to the STP to investigate their feasibility. If any of the conditions is feasible, then the STP determines those values of all the variables involved in the conditions (including the byte values of the input file) that turn the condition to true.
- In the case of the fulfillment of the conditions for triggering dangerous operations, the program is started up by the control module again (this time without any instrumentation) with the corresponding input file to confirm the error found.
- The conditions for bypassing the non-completed parts of the program determine the set of possible input files for new program launches. Thus, after each program launch, the STP tool automatically generates a number of input files for subsequent analysis runs.
- Next comes the task of choosing from this set the most “interesting” input data, i.e. first of all, the input data on which the error is most likely to occur is to be processed. To solve this problem, the heuristic metric is used - the number of previously untapped base blocks in the program (the base block is understood here in the sense that it is defined by the Valgrind framework). To measure the heuristic value, the Covgrind component is used, whose functions also include fixing possible execution errors. Covgrind is a much more lightweight module than Tracegrind, so a relatively quick measurement of the heuristic value for all previously received input files and selection of the input file with its highest value is possible.
Restrictions
- single input file marked or socket
- error analysis is limited to dereferencing a null pointer and dividing by zero.
results
The effectiveness of finding bugs with Avalanche has been investigated on a large number of open source projects.
- qtdump (libquicktime-1.1.3). Three defects are associated with the dereferencing of a null pointer, one - with the presence of an infinite loop, in another case there is a call to an incorrect address (segmentation error). Part of the defects corrected by the developer.
- flvdumper (gnash-0.8.6). The immediate occurrence of a defect is associated with the occurrence of an exceptional situation in the application library used by the application boost (one of the internal pointers of the boost library turns out to be zero). Since the application itself does not catch the exception that has occurred, the program ends with a SIGABRT signal. Defect is corrected by the developer.
- cjpeg (libjpeg7). The application reads a zero value from the file and, without a corresponding check, uses it as a divisor, which causes a floating point exception and terminates the program with a SIGFPE signal. Defect is corrected by the developer.
- swfdump (swftools-0.9.0). The occurrence of both defects is associated with the dereferencing of the null pointer.
KLEE
KLEE is somewhat different from Avalanche in that it does not look for suspicious places, but tries to cover as much code as possible and conduct an exhaustive analysis of the paths in the program. According to the general scheme, KLEE is similar to Avalanche, but uses other basic tools for solving the problem, which imposes its own limitations and advantages.
- Instead of the valgrind instrumentation that Avalanche uses, KLEE analyzes programs in llvm-bytecode. Accordingly, it allows analyzing the program in any programming language for which there is an llvm-backend.
- KLEE also uses STP to solve the boolean constraint problem.
- KLEE also intercepts about 50 system calls, allowing multiple virtual processes to run in parallel without interfering with each other.
- Optimization and caching of requests to STP.
KLEE is a symbolic virtual machine, where symbolic processes run in parallel (within the terminology of KLEE: states ), where each process is one of the paths in the program under study. Effective implementation of forks of such processes (not by the system means) at each branch in the program allows you to analyze a large number of paths simultaneously.
For each unique traversed path, KLEE stores a set of input data required to traverse that path.
The KLEE capabilities allow you to check the equivalence of any two functions ( checking the identical functionality of a working prototype, refactoring ) over the entire range of specified input data at low cost (an extensive API is provided).
The following example illustrates this functionality:
unsigned mod_opt ( unsigned x, unsigned y ) {
if ( ( y & −y ) == y ) // power of two?
return x & ( y− 1 ) ;
else
return x % y ;
}
unsigned mod ( unsigned x, unsigned y ) {
return x % y ;
}
int main ( ) {
unsigned x, y ;
make symbolic ( & x, sizeof ( x ) ) ;
make symbolic ( & y, sizeof ( y ) ) ;
assert ( mod ( x, y ) == mod_opt ( x, y ) ) ;
return 0 ;
}
By running KLEE in this example, you can verify the equivalence of two functions in the entire range of input values (y! = 0). Solving the problem of failure to fulfill the condition in assertion, KLEE, on the basis of enumeration of all possible paths, comes to the conclusion that the two functions are equivalent over the entire range of values.
results
To obtain real test results, the authors analyzed the entire coreutils 6.11 software suite. The average code coverage percentage was 94%. In total, the program generated 3321 sets of input data, allowing to cover the entire specified percentage of code. It was also found 10 unique errors that were recognized by the developers of the package as real defects in the programs, which is a very good achievement, since this set of programs has been developed for over 20 years and most of the errors have been fixed.
Restrictions
- no support for multi-threaded applications, floating-point symbolic data (STP restriction), assembler inserts.
- The application under test must be assembled into llvm-byte code (as well as its libraries!).
- for effective analysis you need to edit the code.
Preliminary findings
Of course, dynamic analysis will find its niche among the tools that help individual programmers and teams of programmers to solve the problem, because is an effective way to find errors in programs, as well as proof of their absence! In some cases, such tools are simply vital (Mission critical software: RTOS, production management systems, aviation software, and so on).
Conclusion
It is planned to continue the topic of the article (the results of some experience with avalanche and KLEE, as well as a comparison of KLEE and Avalanche, a review of S2E (https://s2e.epfl.ch) (Selection Symbolic Execution)) provided positive feedback from Habr readers.
The article contains fragments of the following works: avalanche_article , KLEE , Application of fuzz testing .
Source: https://habr.com/ru/post/128503/
All Articles