Server Monitoring with Websitepulse
 To begin, we would like to write a few words about our services and how they can be useful to you.
First, we have various monitoring levels, which are designed to meet the various requirements of our customers:
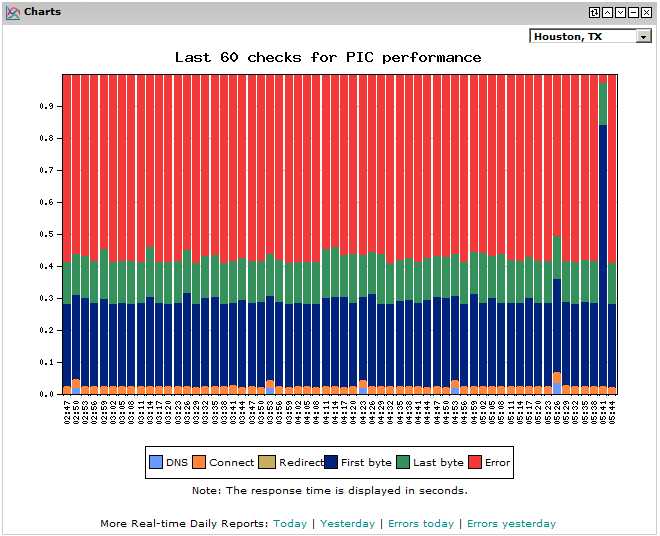
Server monitoring level has two sublevels - Basic and Advanced . One or more locations (depending on user preference) simultaneously monitor a server or a network device that is connected to the Internet. The standardly used check includes opening a connection to the specified server, sending a server-specific request, loading the header and writing the answer to your logs. Reports include DNS response time, connect, time forwarding, first and last byte time. With this monitoring level, users can be sure that their web servers and network devices are always in order, because launched with instant alert notifications with detailed execution and duration reports. This information can help them increase server uptime and reduce the risk of losing customers and revenues due to network or server problems.
')
WebSitePulse system supports most servers and network devices - PING, HTTP, HTTPS, DNS, FTP, POP3, SMTP, IMAP, SSH, Telnet, My SQL, MS SQL, SIP, RTSP, as well as custom servers and devices. Custom port monitoring allows you to test the connection to various TCP / UDP services.
Website monitoring level also has two sublevels - Performance and Full-page . These two monitoring options verify that the service is up and running and that proper content is being delivered. Our system can also verify that the download speed of checked URLs / files is within industry standards. This can help our users not only to improve the duration of their sites, response time and download speed, but also gives them the ability to check for unauthorized changes to the content and visualization of the website.
Performance monitoring check simulates repeated user actions — the monitoring agent executes the specified request and loads the header and the entire content of the HTML web page without images and other attached objects, simulating the user repeating to your website. At this monitoring level, the system can also perform content verification checks for keywords, MD5 hash, and file size.
Full-page level - an enhanced version of Performance level . Our monitoring agents not only download the full HTML content, but also all the images and embedded objects presented on the page.
Another advantage of this level of monitoring is that it supports cookies and specific and client user-agents . These options make this level useful for monitoring simple logins and sites that only work with a specific browser.
The Transaction monitoring level - controls the use and execution of multi-step network transactions and web applications that they use. The main goal is to make sure that they function correctly and the delivery is executed, which, in fact, is expected by the end user . A good example of network transactions is user logins, fulfillment of the purchase order; submitting different types of web forms and other user contacts with the website and web applications.
Transactions fall into three main categories: Performance, Full-Page and Custom script .
Checks of each step of a specific transaction are performed as follows:
Performance Transaction checks are based on Website Performance monitoring level. This means that at each step, our monitoring agent downloads full HTML content and can run all content verification checks.
Full-Page Transaction checks are based on Full-Page-monitoring , which loads HTML-content, images and all other embedded objects for each transaction step.
Custom Script can be created to test a complex web transaction. This is suitable for complex websites using rich Internet applications, AJAX, Web 2.0, dynamic JavaScript redirects , dynamic parameters and more. This target type is configured with the help of our engineers (at no extra charge), based on detailed client instructions.
Email System Monitoring with round-robin monitoring of the use and execution of a circular two-step session of a simple e-mail to ensure that your incoming and outgoing mail services are working correctly and continuously.
The E-mail Monitoring agent will connect to the output (SMTP) of the mail server, send a test message, and then connect and log in to your incoming (POP3 or IMAP) server, and try to return the message. If the message returns, the test is successful and the message will be deleted from your e-mail system. If the message does not return, the test fails and the alarm will be activated and sent to a specific contact. Alarms and messages will make it clear in what situation the test of the mail system is unsuccessful, so that problems can be eliminated for a minimum time. This can help our users eliminate the risk of losing, delaying or non-functioning of e-mail communications with customers and partners.
Another very important aspect of our system is a wide range of warning options. Our clients can receive alarm alerts on their own devices, so that they will always be informed of the problem on the server, website, or transaction, as soon as it is detected. Notifications help them pinpoint and resolve issues more quickly, thereby reducing revenue losses resulting from unexpected temporary downtime. Clients can receive alerts through the following channels: e-mail, e-mail2SMS, SMS, voice call, pager, instant messenger, SNMP traps and URLs.
Notifications can be configured for each monitoring location and each target. In addition, the content of the warnings also has many customization options, and the client receives various warnings for various errors with the “remake” option for the length and content of each message. To avoid unnecessary notifications in the case of co-dependent targets (for example, a server and a website on this server), the client can create custom-dependent rules. In addition, detected errors can be correlated in real time through multiple locations , and notifications can be sent only if all or a certain number of monitoring locations report some error.
Three configuration levels are used:
- normal — alerts are sent if at least one location detects an error;
- strong — alerts are sent if at least 50% of the monitoring locations of a specific target have detected an error;
- strict — warnings are sent only if 100% of the monitoring locations of a specific target detected an error;
In addition to alerts, reports that our system offers can also provide meaningful information about the full status of checks. A wide variety of reports can be generated online, including detailed check-by-check reports, monthly summaries, multiple location reports and comparative reports, each of which includes different types of graphs and charts. Most reports can also be sent via regular email. Our clients can also download the necessary information directly from our servers using our real-time WSDL API . Of course, if our customers have special reporting requirements, our developers can create customized reports at no additional charge.
Here are some of the most useful features of our service:
- Precise error detection and "triple stage" verification system
(Accurate error detection and “three-time” verification system) - each detected error is checked with three additional resources before it is confirmed and registered;
- Forced monitoring upon error detection
(Forced monitoring after detecting an error) - if you use reduced monitoring intervals, for example, every 10 or 20 minutes, when the error is detected, monitoring will automatically switch to every 1 or 3 minutes, providing you with faster “recovery” status, faster notifications and more accurate uptime / downtime statistics;
- Traceroute upon connectivity errors detected
(Traceroute for detected connection errors) - every time a connection error is detected, the traceroute will be executed from the monitoring location to the verified target, and the results will be stored in reports for future display. Traceroute results can be included in an e-mail warning;
- “Snapshot" upon error - if an error is detected, a snapshot of the web page will be made and saved. Later, for each error, the snapshot can be viewed in reports;
- "Snapshot" of the last check
("Snapshot" of the last check) - a snapshot of the web page from the last check. Provided in the target details section, regardless of the target-status;
- Configurable downtime periods
(Configurable downtime periods) - if you have maintenance windows marked with maintenance, set up time periods for each target, during which monitoring will be automatically suspended and then automatically resumed at the end of the period to avoid unnecessary warnings.
- 24/7 free customer support
(24/7 customer support) - user and live support is available 24/7 by phone and email, along with the extensive WebSitePulse monitoring and maintenance section;
- Takeover - at certain times of the day or night or weekend, you can pass all your warnings to our 24/7 online support team, which will receive them and will act on the basis of instructions predefined by you and your IT group. That is, when our 24/7 online support team receives your alerts, they will check your instructions and restart the server, or contact the next level of support or anything else you could do. We will act within the instructions provided to us by you.
Detailed information and a 30-day free period can be found on our website: www.websitepulse.com
Information about Russian-language support and information about us can be found on our Russian website: www.websitepulse.ru
If there are additional questions - ask them in the comments and we will be happy to answer them.
That's all for now. Thank you for your attention!
Source: https://habr.com/ru/post/128242/
All Articles