Statistical data visualization with Highcharts
In this article, I would like to present my own experience of constructing visual and presentable graphs using Highcharts based on OS statistics and disk arrays. For many modern operating systems and disk arrays, there are mechanisms based on embedded or additional software that allow you to obtain data on the operation of OS subsystems or an array (meaning not tracing, but statistical indicators averaged over a given interval). You can also collect packet and error counter statistics on the interfaces of the LAN and FC switches. Many people want to visualize this data and use it in reports or in a samopinny monitoring system.

Disclaimer: I am not and do not work as a programmer and have verydubious limited abilities to write code, so do not hurt much for its quality. In this case, I will be glad if you note that you can optimize and rewrite shorter / clearer / kosher.
At different times, I had to and had to process Measureware * data installed on HP-UX and Linux servers, statistics on the operation of the HP Storageworks XP, HP EVA, EMC Clariion, EMC Symmetrix arrays, build graphics of the Brocade FC interfaces load. Potentially, using Highcharts and not only you can draw graphs based on any statistics presented in CSV format and sorted by time. You can also draw graphs in real time, the data will be collected using SNMP. Many, of course, will say that the well-known Cacti is great for realtime and the accumulated statistics collected using SNMP, and they will be right: the Internet is full of Cacti deployment guides and monitoring settings for various equipment, many dogs have been eaten, and without jambs deploy such monitoring is very high. I went from graphs built using Excel to images generated using rrdtool and gnuplot, and finally to Highcharts. It is possible that not everyone is satisfied with the solutions mentioned, and someone interested in the method described by me.
* Measureware (OpenView Performance Agent) allows you to track the utilization of OS resources (HP-UX, Linux, Windows) at the moment and view the accumulated data, upload them to the ASCII format for further processing. With it, you can get the values of key metrics for the operation of different OS subsystems, individual processes, customized application groups (for example, all ora_dbw * processes in the system). Measureware data is used along with tracing the OS and its processes to identify potential bottlenecks in system performance. The information is not for publicity purposes, I no longer work at HP, I just wanted to mention a handy tool that deserves a separate article (by the way, are the topics of software used on proprietary industrial versions of UNIX interesting?).
')
This is a library for building graphs using Javascript. Nominally uses the browser to render and display interactive graphs. What is Highcharts good for? Everything isglamorous and rendered in your favorite FF in Chrome and Safari (on i-technology too), in IE too; you can interact with charts: zoom, disable unnecessary charts or highlight needed ones, add new points, use mouse click handlers, tooltips, etc .; input data can be read from the local file, use AJAX, access the database, receive in the json format (forgive me if I do not correctly formulate it or use incorrect terms). Also, using mouse manipulations, the obtained graphs can be saved in PNG images. At some point I needed to generate a lot of different pictures and was too lazy to move a lot and click the mouse, I wanted to make a batch. My Nuba attempts in mastering node, rhino and other trinkets described on the Highcharts support forum (by the way, they respond and help quite quickly and amiably) do not lead to anything. For this, I discovered the iecapt.exe utility (as I understood it, the analogue cutycapt, about which there are a couple of articles on Habré) - when setting the corresponding pauses for processing the JS code and rendering, the same images are obtained as for export from the browser.
It must be said that exporting to PNG / JPEG / PDF is based on converting SVG to PNG using server-side modules and libraries and requires a php page on the server, or a redirect to highcharts.com. In the latest versions of Highcharts, by the way, they fixed the export of scaled (zoomed in) graphs and graphs built dynamically. Without exporting graphics, you can view them locally by running a simple html file with a JS body kit and locally saved jquery.js. Also for export you can use the mentioned utility iecapt / cutycapt. To get real-time traffic statistics on FC switches, I used the php page, which, using the php_snmp module, regularly polled the required OID in the MIB tree on the switch and parsed the data. It should be remembered that any SNMP requests consume switch processor cycles and should not be overloaded with overly frequent requests. Brocade even has a service note on this topic: high processor utilization can lead to resets of FC ports, the probability is low, but it exists and depends on the type of transceiver used (manufacturer and firmware revision). Sorry for offtopic, but "forewarned is forearmed."
For visualization, you can use the following types of graphs:
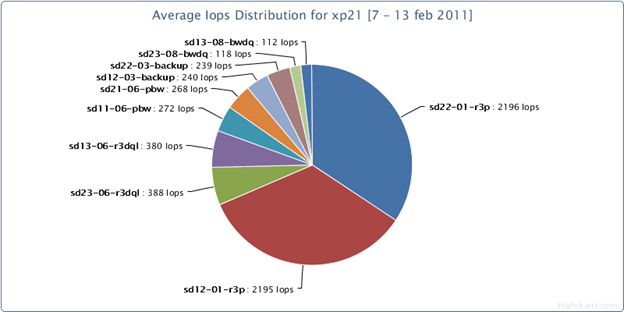
Pie - for example, to show the distribution of server groups in the load on the frontend adapter:
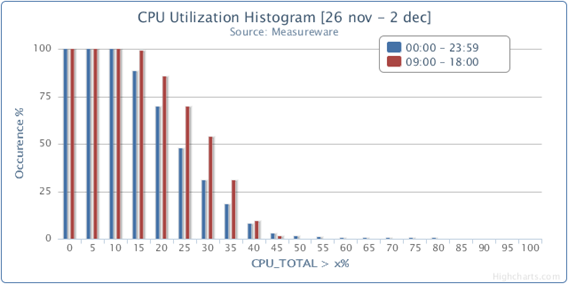
Column - to build histograms:
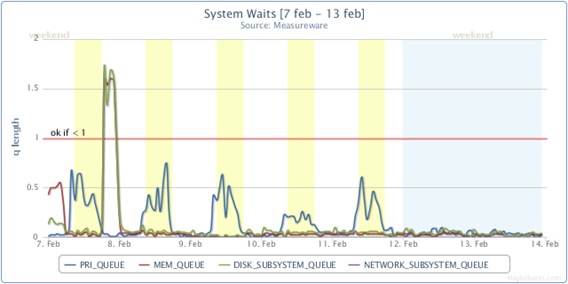
Spline - for heterogeneous metrics, and you can use several axes with your own scale and scale and link them with different graphs:
Area or Areaspline to demonstrate the effect of the overlay of metrics:

Or vice versa - opposing multidirectional traffic flows on switch interfaces:

On the Highcharts project page you will find many other useful and interesting types of charts. The project is developing, there are updates, on the forum you can find many useful recipes.
So what do we have at the entrance? I deliberately omit the step of collecting data and uploading them to CSV format, because This is the topic of a separate article for each of the operating systems or disk arrays used. So, we will need either a table of values of different metrics (horizontally), changing with time (vertically), with a corresponding heading, for example like this:
Unixtime, metric1, metric2, metric3
1297666800, val1_1, val2_1, val3_1
1297666860, val1_2, val2_2, val3_2
and so on
The data can also be presented in the form of a table, where each line lists the values of a specific metric, measured at equally spaced time intervals, for example like this (the title contains the Title for the graph, point of reference and interval):
Lan0 stats, 1297666800, 600
Rx bps, 2000, 3000, 4000
Tx bps, 1200, 1600, 2000
My page for interactive selection of displayed metrics looks like this and uses files with the first data layout option (i.e., the metrics horizontally, in each line of their value at a certain time interval):

The only thing is that in my input file there are additional fields and a line with a header for the possibility of using files in another program for processing statistics and plotting graphs.
The necessary files for this page are as follows:
Archive with files uploaded to http://ge.tt/96cqBa7 and http://depositfiles.com/files/06h2ky72e + http://depositfiles.com/files/o6ycfl3kw (a larger archive is a JS kit and libraries needed for export to PNG)
In the case of constructing realtime graphics, before receiving fresh traffic data from the switch, you can query the database, which regularly downloads statistics from the switch (obtained, for example, via SNMP), and plot these points on the chart. Subsequent requests for new data will add “fresh” points and shift the graph.
By the way, I could not overcome the translation of the time at the right timezone for realtime graphs. Thanks in advance to someone who finds a solution.
For the option of the data in the CSV file as strings with the values of a certain metric, thisshit code is suitable before calling “var chart = new Highcharts.Chart (options);”:
provided that the values are collected at regular intervals (series.pointInterval) and do not have “gaps”.
Finally, some tips and recipes from the forum:
I really like the Highcharts library and the graphics that can be done with it. Hope you enjoyed it too.
UPD: tell me where it is more reliable to shift the archives with scripts, and then surely it will get rotten to ge.tt and depositfiles?
Disclaimer: I am not and do not work as a programmer and have very
At different times, I had to and had to process Measureware * data installed on HP-UX and Linux servers, statistics on the operation of the HP Storageworks XP, HP EVA, EMC Clariion, EMC Symmetrix arrays, build graphics of the Brocade FC interfaces load. Potentially, using Highcharts and not only you can draw graphs based on any statistics presented in CSV format and sorted by time. You can also draw graphs in real time, the data will be collected using SNMP. Many, of course, will say that the well-known Cacti is great for realtime and the accumulated statistics collected using SNMP, and they will be right: the Internet is full of Cacti deployment guides and monitoring settings for various equipment, many dogs have been eaten, and without jambs deploy such monitoring is very high. I went from graphs built using Excel to images generated using rrdtool and gnuplot, and finally to Highcharts. It is possible that not everyone is satisfied with the solutions mentioned, and someone interested in the method described by me.
* Measureware (OpenView Performance Agent) allows you to track the utilization of OS resources (HP-UX, Linux, Windows) at the moment and view the accumulated data, upload them to the ASCII format for further processing. With it, you can get the values of key metrics for the operation of different OS subsystems, individual processes, customized application groups (for example, all ora_dbw * processes in the system). Measureware data is used along with tracing the OS and its processes to identify potential bottlenecks in system performance. The information is not for publicity purposes, I no longer work at HP, I just wanted to mention a handy tool that deserves a separate article (by the way, are the topics of software used on proprietary industrial versions of UNIX interesting?).
')
What is Highcharts and what does it eat?
This is a library for building graphs using Javascript. Nominally uses the browser to render and display interactive graphs. What is Highcharts good for? Everything is
It must be said that exporting to PNG / JPEG / PDF is based on converting SVG to PNG using server-side modules and libraries and requires a php page on the server, or a redirect to highcharts.com. In the latest versions of Highcharts, by the way, they fixed the export of scaled (zoomed in) graphs and graphs built dynamically. Without exporting graphics, you can view them locally by running a simple html file with a JS body kit and locally saved jquery.js. Also for export you can use the mentioned utility iecapt / cutycapt. To get real-time traffic statistics on FC switches, I used the php page, which, using the php_snmp module, regularly polled the required OID in the MIB tree on the switch and parsed the data. It should be remembered that any SNMP requests consume switch processor cycles and should not be overloaded with overly frequent requests. Brocade even has a service note on this topic: high processor utilization can lead to resets of FC ports, the probability is low, but it exists and depends on the type of transceiver used (manufacturer and firmware revision). Sorry for offtopic, but "forewarned is forearmed."
What can I get with Highcharts at the exit?
For visualization, you can use the following types of graphs:
Pie - for example, to show the distribution of server groups in the load on the frontend adapter:
Column - to build histograms:
Spline - for heterogeneous metrics, and you can use several axes with your own scale and scale and link them with different graphs:
Area or Areaspline to demonstrate the effect of the overlay of metrics:
Or vice versa - opposing multidirectional traffic flows on switch interfaces:
On the Highcharts project page you will find many other useful and interesting types of charts. The project is developing, there are updates, on the forum you can find many useful recipes.
Processing of accumulated data from a file and incoming in real time
So what do we have at the entrance? I deliberately omit the step of collecting data and uploading them to CSV format, because This is the topic of a separate article for each of the operating systems or disk arrays used. So, we will need either a table of values of different metrics (horizontally), changing with time (vertically), with a corresponding heading, for example like this:
Unixtime, metric1, metric2, metric3
1297666800, val1_1, val2_1, val3_1
1297666860, val1_2, val2_2, val3_2
and so on
The data can also be presented in the form of a table, where each line lists the values of a specific metric, measured at equally spaced time intervals, for example like this (the title contains the Title for the graph, point of reference and interval):
Lan0 stats, 1297666800, 600
Rx bps, 2000, 3000, 4000
Tx bps, 1200, 1600, 2000
My page for interactive selection of displayed metrics looks like this and uses files with the first data layout option (i.e., the metrics horizontally, in each line of their value at a certain time interval):
The only thing is that in my input file there are additional fields and a line with a header for the possibility of using files in another program for processing statistics and plotting graphs.
The necessary files for this page are as follows:
- mwa.htm - the main page with the choice of the file, its metrics and drawing graphs;
- jquery.js - put this well-known library nearby, or use it located on an external web server (those who are looking for it will find where);
- Fresh js and exporting server folders are downloaded from the Highcharts project site. On page tyts told how to set up a local export;
- getlist.php - needed to perform an asynchronous request to search for input CSV files with statistics on a template, called from mwa.htm;
- mwa_S-DB-1__weekG.csv with an example of statistical data on the work of HP-UX host for the week;
- live_snmp_only.php - an additional page for plotting the loading of the FC port of the Brocade switch, called with the request "live_snmp_only.php? host = 10.20.30.40 & fcPort = 20". community is written in the following file;
- snmp64.php - is regularly called from live_snmp_only.php and receives the outgoing and incoming speeds of the FC operation of the Brocade switch port (with Cisco FC or LAN there was no experience to tie, you probably just need to use the appropriate OID). Older versions of FOS may not have 64-bit counters.
Archive with files uploaded to http://ge.tt/96cqBa7 and http://depositfiles.com/files/06h2ky72e + http://depositfiles.com/files/o6ycfl3kw (a larger archive is a JS kit and libraries needed for export to PNG)
In the case of constructing realtime graphics, before receiving fresh traffic data from the switch, you can query the database, which regularly downloads statistics from the switch (obtained, for example, via SNMP), and plot these points on the chart. Subsequent requests for new data will add “fresh” points and shift the graph.
By the way, I could not overcome the translation of the time at the right timezone for realtime graphs. Thanks in advance to someone who finds a solution.
For the option of the data in the CSV file as strings with the values of a certain metric, this
// Verticaly dispersed data:
var items = lines[metricNo].split(',');
series.name = items[0];
$.each(items, function(itemNo, item) {
if (itemNo>0 && parseInt(item)>=0) {
series.data.push(parseInt(item)); // its important to parseInt !!!!
}
});
series.pointStart = parseInt(start); // its important to parseInt !!!!
series.pointInterval = parseInt(interval);
options.series.push(series);*/
provided that the values are collected at regular intervals (series.pointInterval) and do not have “gaps”.
Finally, some tips and recipes from the forum:
- Try not to use more than 500 points on the chart, otherwise decent brakes will begin.
- Do not forget that the time in the unixtime format must also be multiplied by 1000 so that it is correctly displayed on the graph.
- About the selection of points on some of the graphs can be found here: http://highslide.com/forum/viewtopic.php?f=9&t=8101
- How to build multiple graphs on one htm page and add new points for the event: http://highslide.com/forum/viewtopic.php?f=9&t=8030 and http://jsfiddle.net/QCefk/1/
- Change the color of graphics on hover: http://jsfiddle.net/vu8DB/
- Plotting within the “corridor”, indicating, for example, measurement error or scatter of values: http://jsfiddle.net/pHFfF/3/
- Scaling with mouse scrolling: http://jsfiddle.net/HXUmK/4/
- Double X axis: http://jsfiddle.net/PPAUx/26/
- Finding the lows and highs: http://jsfiddle.net/ebuTs/7/
I really like the Highcharts library and the graphics that can be done with it. Hope you enjoyed it too.
UPD: tell me where it is more reliable to shift the archives with scripts, and then surely it will get rotten to ge.tt and depositfiles?
Source: https://habr.com/ru/post/128115/
All Articles