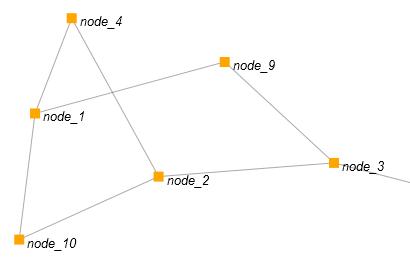
Graph visualization using arbor.js library
Some time ago, I needed to visualize the graphs and wanted to find a ready-made solution that would not reinvent the next bike. I came across the arbor library, which using jQuery provides the ability to render quite acceptable graphs in the browser.
The library itself, as well as documentation and examples (all in English) can be downloaded from the official website.
And so in order.
The html5 canvas is used as a canvas, which means that it will not work in browsers that do not support it.
Create a simple page that loads JSON data about vertices and edges with AJAX. We will take as an example the bundled example and modernize it (data loading, mapping).
Create a data file, where we list all the vertices and edges
data.json:
')
In the main file we will connect the necessary libraries, and also we will take out all js scripts
In the body of the document create a canvas in which we will draw
Now, in order, how it will work.
When fully loaded, an object is created with settings for arbor, which also contains functions that will be executed upon the occurrence of various events, the drawing functions of each vertex and face (this is what I liked the library, which allows you to configure almost everything).
Next, this object is passed to the arbor constructor, which will launch the entire carousel.
Data loading is also carried out immediately after the page is fully loaded.
In general, the code here is more than words, so I think it will be clearer and clearer to go directly to it with detailed comments.
main.js:
I liked the library itself because it allows me to draw the vertices and faces, as well as adjust actions for any events.
The source can be downloaded here.
The library itself, as well as documentation and examples (all in English) can be downloaded from the official website.
And so in order.
The html5 canvas is used as a canvas, which means that it will not work in browsers that do not support it.
Create a simple page that loads JSON data about vertices and edges with AJAX. We will take as an example the bundled example and modernize it (data loading, mapping).
Create a data file, where we list all the vertices and edges
data.json:
')
{
"nodes": [
{"name": "node_1"},
{"name": "node_2"},
{"name": "node_3"},
{"name": "node_4"},
{"name": "node_5"},
{"name": "node_6"},
{"name": "node_7"},
{"name": "node_8"},
{"name": "node_9"},
{"name": "node_10"}
],
"edges": [
{"src": "node_3", "dest": "node_2"},
{"src": "node_5", "dest": "node_3"},
{"src": "node_8", "dest": "node_7"},
{"src": "node_1", "dest": "node_4"},
{"src": "node_7", "dest": "node_5"},
{"src": "node_3", "dest": "node_9"},
{"src": "node_2", "dest": "node_4"},
{"src": "node_6", "dest": "node_5"},
{"src": "node_9", "dest": "node_1"},
{"src": "node_10", "dest": "node_2"},
{"src": "node_1", "dest": "node_10"}
]
}
In the main file we will connect the necessary libraries, and also we will take out all js scripts
<script src="js/jquery.min.js"></script> <script src="js/arbor.js"></script> <script src="main.js"></script> In the body of the document create a canvas in which we will draw
<canvas id="viewport" width="800" height="600"></canvas> Now, in order, how it will work.
When fully loaded, an object is created with settings for arbor, which also contains functions that will be executed upon the occurrence of various events, the drawing functions of each vertex and face (this is what I liked the library, which allows you to configure almost everything).
Next, this object is passed to the arbor constructor, which will launch the entire carousel.
Data loading is also carried out immediately after the page is fully loaded.
In general, the code here is more than words, so I think it will be clearer and clearer to go directly to it with detailed comments.
main.js:
(function($){ var Renderer = function(canvas) { var canvas = $(canvas).get(0); var ctx = canvas.getContext("2d"); var particleSystem; var that = { init:function(system){ // particleSystem = system; particleSystem.screenSize(canvas.width, canvas.height); particleSystem.screenPadding(80); that.initMouseHandling(); }, redraw:function(){ // ctx.fillStyle = "white"; // ctx.fillRect(0,0, canvas.width, canvas.height); // particleSystem.eachEdge( // function(edge, pt1, pt2){ // ctx.strokeStyle = "rgba(0,0,0, .333)"; // ctx.lineWidth = 1; // ctx.beginPath(); // ctx.moveTo(pt1.x, pt1.y); // ctx.lineTo(pt2.x, pt2.y); // ctx.stroke(); }); particleSystem.eachNode( // function(node, pt){ // var w = 10; // ctx.fillStyle = "orange"; // ctx.fillRect(pt.xw/2, pt.yw/2, w,w); // ctx.fillStyle = "black"; // ctx.font = 'italic 13px sans-serif'; // ctx.fillText (node.name, pt.x+8, pt.y+8); // }); }, initMouseHandling:function(){ // var dragged = null; // var handler = { clicked:function(e){ // var pos = $(canvas).offset(); // canvas _mouseP = arbor.Point(e.pageX-pos.left, e.pageY-pos.top); // canvas dragged = particleSystem.nearest(_mouseP); // if (dragged && dragged.node !== null){ dragged.node.fixed = true; // } $(canvas).bind('mousemove', handler.dragged); // $(window).bind('mouseup', handler.dropped); // return false; }, dragged:function(e){ // var pos = $(canvas).offset(); var s = arbor.Point(e.pageX-pos.left, e.pageY-pos.top); if (dragged && dragged.node !== null){ var p = particleSystem.fromScreen(s); dragged.node.p = p; // } return false; }, dropped:function(e){ // if (dragged===null || dragged.node===undefined) return; // , if (dragged.node !== null) dragged.node.fixed = false; // - dragged = null; // $(canvas).unbind('mousemove', handler.dragged); // $(window).unbind('mouseup', handler.dropped); _mouseP = null; return false; } } // $(canvas).mousedown(handler.clicked); }, } return that; } $(document).ready(function(){ sys = arbor.ParticleSystem(1000); // sys.parameters({gravity:true}); // sys.renderer = Renderer("#viewport") // $.getJSON("data.json", // function(data){ $.each(data.nodes, function(i,node){ sys.addNode(node.name); // }); $.each(data.edges, function(i,edge){ sys.addEdge(sys.getNode(edge.src),sys.getNode(edge.dest)); // }); }); }) })(this.jQuery) I liked the library itself because it allows me to draw the vertices and faces, as well as adjust actions for any events.
The source can be downloaded here.
Source: https://habr.com/ru/post/128047/
All Articles