HTML and SVG: creating an interactive map
 Let's create an interactive map. Something. What does interactive mean? Well, it must interact with the user and with the data on the web page on which it is located. I think this is enough to consider it interactive.
Well, we take SVG. Why? Because it’s easy to work with someone familiar with HTML. SVG is an XML-based vector format. That is, the SVG image has its own DOM, you can apply CSS rules to various elements and manage the good old JavaScript.
Well, let's start?
The most impatient, can immediately see the demo , but I suggest reading about everything in order.
')
Preparing a map
First we need the essence. I mean the card itself. If Google doesn't help, then you can draw it yourself, even though it's not hard to do in Inkscape .
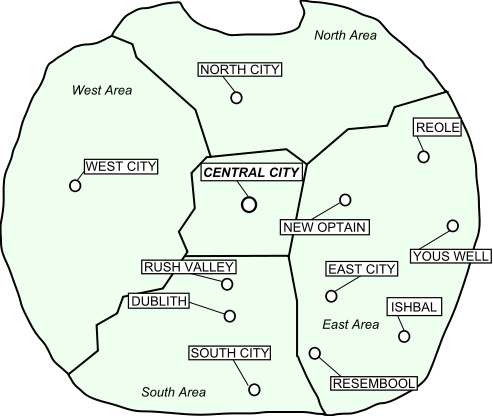
I, for example, will take a map of one round country ( source for Wikimedia Commons )
Since, in my plan, the map areas should not have a different color, first I cut out the fill and stroke styles from the <path> tags that interest me, but instead I give these elements the class and id I need. For example, class = “area” for regions and class = “city” for cities.
Next, in the <defs> section of the image we place a painfully familiar:
<style type="text/css"> .area { stroke: black; stroke-width: 2px; fill: #E9FFE9; } .city { stroke: black; stroke-width: 2px; fill: red; } </style> Here is the CSS I promised in action. In principle, this is already enough. Diff .
Result:
Insert SVG into HTML
This process was covered in sufficient detail in the habratopic On the issue of cross-browser use of SVG .
We will use HTML5 and use the easiest, most humane and standard way:
<object data="map.svg" type="image/svg+xml" id="imap" width="500" height="420"></object> All browsers that support SVG correctly "eat" it and show it. And even give us work with him. On one condition: if the web server returns it with the MIME type image / svg + xml. Another MIME type can be very embarrassing to Google Chrome (but not Opera, which from the tag firmly knows what comes after SVG and cannot be provoked).
The second correct method is to insert SVG code directly into HTML. Great in terms of scripting, but browser support is worse . By the way, notice that SVG, inserted into “liberal” HTML, still remains “stern” XML. So quotes and closing tags are required.
Underwater rake
But not everything is so simple. Immediately you can see that browsers stubbornly do not want to scale our map, and if it does not fit, then show the scroll bars, like this:
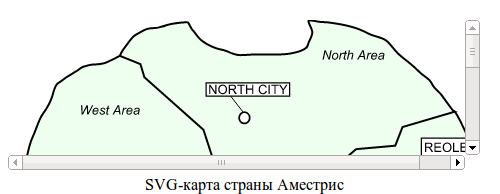
To force browsers to work with SVG in the way we expect, remove the width and height attributes from the <svg> tag in the SVG file (or set them to 100%), and insert the viewBox attribute that is specifically designed for browsers with the coordinates of the upper left and lower right corner of the image:
viewBox="0 0 493 416" Diff .After that, the situation is much improved, but Google Chrome puts another one on us: it stubbornly seeks to scale the image to the height of the <object> element, rather than increasing the height of <object> according to the tag's width and image proportions like other browsers.
It's a pity. It is necessary to attract JavaScript and adjust the height of the element manually.
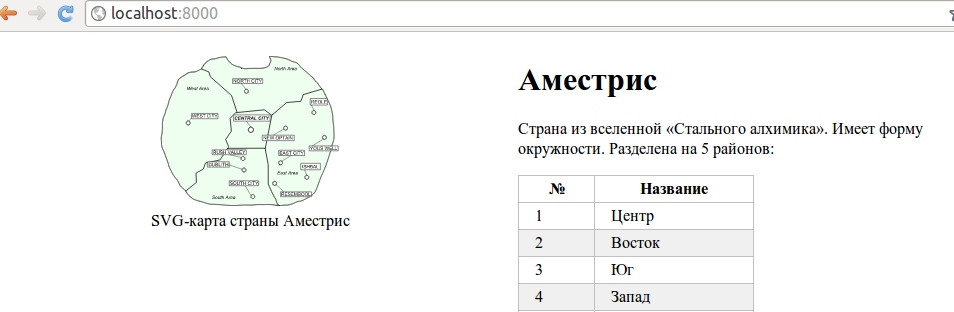
var viewBox = svgdom.rootElement.getAttribute("viewBox").split(" "); var aspectRatio = viewBox[2] / viewBox[3]; svgobject.height = parseInt(svgobject.offsetWidth / aspectRatio); Diff .Result:
Interact with SVG
In order for us to interact with SVG, written directly in HTML, nothing is needed - it is already part of the DOM web page.
Accessing an SVG inserted through <object> is a bit more complicated:
jQuery(window).load(function () { // , ( ) , window.onload, var svgobject = document.getElementById('svgmap'); // <object> if ('contentDocument' in svgobject) { // - ? var svgdom = jQuery(svgobject.contentDocument); // SVG- // , : jQuery("#figure1", svgdom).attr("fill", "red"); // id="figure1" SVG DOM } }); Yes, jQuery works with SVG, but only partially. For example, I noticed that the addClass and removeClass functions, as well as the search by class (
jQuery(".class") ), do not work. It is necessary to pervert.Notice that I use the window.onload event, since we need to wait until the page is fully loaded, along with all the related elements (including our map). However, even here Google Chrome is in a hurry to put a pig on us: if the script with window.onload is in the html code before the <object> tag, then the code in the handler is executed BEFORE the map actually loads. Therefore, the <script> tag must be placed after our map. Sad but true.
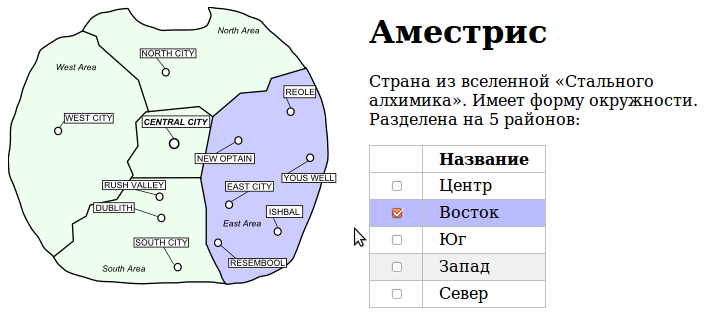
Interactivity first: select areas on the map by clicking on the checkbox on the page.
For this interaction, we will need checkboxes in each row of the table with areas, as well as matching or similar id at the lines of the table and areas on the map.
Here, when clicking on the checkbox, we will set or remove the
selected class from the corresponding area on the map, and already near the line itself. It is not difficult: $("#areas input[type=checkbox]").change(function() { var row = $(this).parent().parent(); var id = row.attr("id"); if (this.checked) { row.addClass("selected"); $("#"+id, svgdom).myAddClass("selected"); } else { row.removeClass("selected"); $("#"+id, svgdom).myRemoveClass("selected"); } }); Accordingly, you need to add style definitions for this class. I give you this to do it yourself, according to your tastes and preferences. Diff .
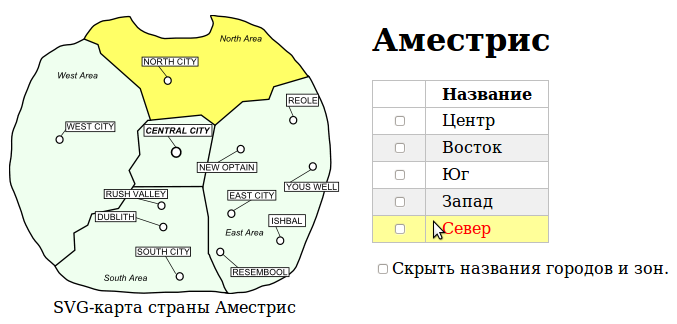
Interactivity two: open / show names on the map by clicking on the checkbox on the page.
This interaction is made even easier. We insert into the
<input type="checkbox" id="titleswitch"> and a little javascript that adds / removes the hidden {visibility: hidden;} class to all map-related items on the map: $("#titleswitch").change(function () { var elements = $(svgdom.getElementsByClassName("areatitle")) .add($(svgdom.getElementsByClassName("citytitle"))) .add($(svgdom.getElementsByClassName("titlebox"))) .add($(svgdom.getElementsByClassName("titleline"))); if (this.checked) { elements.myAddClass("hidden"); } else { elements.myRemoveClass("hidden"); } }); Here it is .

Third interactivity: highlight areas on the map when you hover over a row in a table (and vice versa)
To do this, you need to hang the onhover event handlers as on the table:
// . . $("#areas tr").hover( function () { var id = $(this).attr("id"); $("#"+id, svgdom).myAddClass("highlight"); }, function () { var id = $(this).attr("id"); $("#"+id, svgdom).myRemoveClass("highlight"); } ); ... and on the districts on the map:
// . $(svgdom.getElementsByClassName("area")).hover( function () { var id = $(this).attr("id"); $("#areas #"+id).addClass("highlight"); }, function () { var id = $(this).attr("id"); $("#areas #"+id).removeClass("highlight"); } ); In order for us to see this, add the appropriate CSS rules to the page:
tr.highlight, tr:hover, tr:nth-child(even):hover { background: lightyellow; } ... and to the SVG map: .highlight, .area:hover { fill: lightyellow; stroke: black; } When you hover the mouse on a row of a table (or on a district on a map) on a corresponding region on a map (on a row of a table), the class required for highlighting is hung. In order for the above code to work, it is necessary that the areas on the map and the rows of the table have the same (or similar) id. Diff .
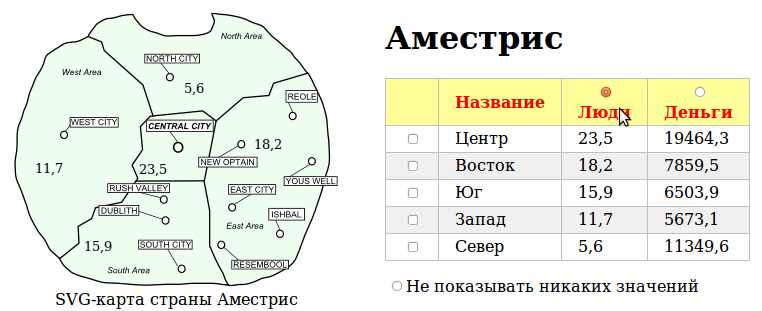
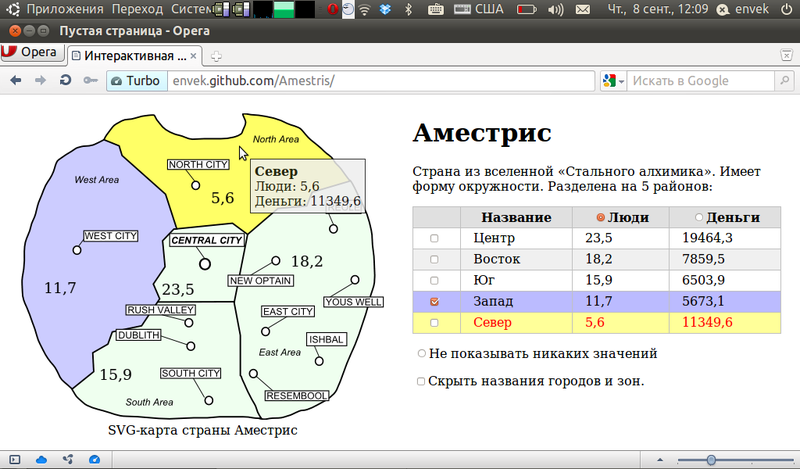
Interactivity fourth: We display data from the page on the map
Well, banal assignment of classes, probably, already bored. Let the map show us some data on yourself.
First things first: data. Add a couple of columns to our plate, for example, People and Money. Attention : The data are taken from the bald and have nothing to do with the real Amestris. As well as radio buttons, by which we will switch, what data to show.
Secondly, we need a place on the map where the data will be displayed. Add five <text> blocks to the map (one for each region, matching their id with the regions) and the corresponding styles in <defs>:
<text class="areavals" x="190.29787" y="246.35461" id="text3186"></text> Well, and JavaScript-code, which will take data from the cells of the table and put in blocks of text:
$("input[name=tabledata]").change(function () { var descnum = $(this).parent().prevAll().length+1; $("#areas tbody tr").each(function() { var id = $(this).attr("id").substring(4); var value = $(this).children(":nth-child("+descnum+")").text(); $("#text"+id, svgdom).text(value); }); }); And by switching radio buttons, the map will show the necessary numbers. Voila !
Interactivity fifth: tooltips
Perhaps this is already superfluous, but let it be. For even counting.
For this interaction, take the jQuery.tooltip plugin and tie it to areas on the map. The text for the tips will be taken, of course, from the table:
$(svgdom.getElementsByClassName("area")).tooltip({ bodyHandler: function() { var id = $(this).attr("id"); var area = $("#areas #"+id+" td:nth-child(2)").text(); var result = $("<p>").append($("<strong>").text(area)); $("#areas #"+id+" td:nth-child(2)").nextAll().each(function(){ var pos = $(this).prevAll().length+1; var title = $("#areas thead th:nth-child("+pos+")").text(); var value = $(this).text(); result.append($("<p>").text(title + ": " + value)); }); return result; } }); 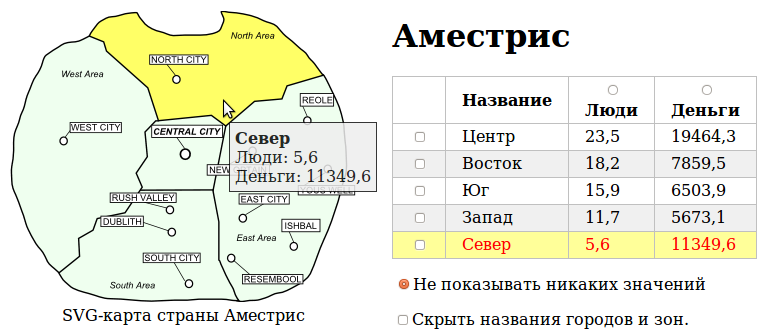
Diff .
And so on…
Of course, the possibilities of interaction with SVG are not limited to this. You can do everything . Shuffle the DOM, change the page and SVG for AJAX requests and much, much more. Dare.
Result
The remaining pitfalls
Of the known problems so far it can be noted that Google Chrome does not print SVG-pictures. This is either his bug or the WebKit bug in general.
backward compatibility
Almost all modern browsers support SVG: IE 9+, Opera 8+, Firefox 3+ (in Firefox 1.5+ partial support), all versions of Chrome, Safari 3.2+ ( more complete list )
But alas, the bright future will not come all the way and we still have to think about the support of the old browsers.
The standard and easiest way, if the SVG is just a picture: insert the replacement content (a rendered image and a paragraph of text in the PNG) inside the <object> tag.
<object data="map.svg" type="image/svg+xml" id="imap" width="600" height="500"> <img src="map.png" alt=" " width="600" height="500"> <p> , , .</p> </object> If there is no SVG support in the browser, a PNG image and text will be shown to notify users that their browser is out of date. No interactive. However, it may not be very necessary. True, there is one drawback - as I noticed, modern browsers stubbornly download the replacement png-picture for themselves, despite the fact that they will not display it anyway.
Those interested can take advantage of the detection of SVG support using Modernizr and heap up something more complicated on javascript.
In more complex cases, multiple solutions in Flash, VML or Canvas (or all of them) can help. The list can be found here: HTML5 Crossbrowser Polyfills , but those solutions that I tried, unfortunately, did not help me. Perhaps because that SVG with CSS that I sketched on my knee turned out to be too tough for them.
Convert SVG to PNG
There are many places in the network where you can convert an SVG image into something else. I will suggest using the rsvg-convert command from the librsvg2-bin package. Like this:
cat map.svg | rsvg-convert > map.png However, it can convert to other formats, as well as increase / decrease the image, see - help.
For mass transformations, you can compose a team more difficult or see examples in the forum thread , where I found this command.
Instead of conclusion
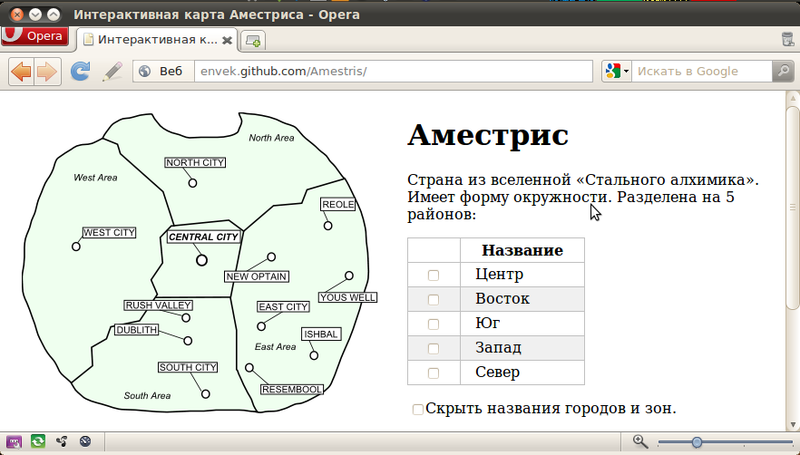
Well that's all. Upon closer inspection, this is not so difficult, and most importantly, everything is close and familiar to the web developer. See what I wrote above in the form of a demo page , tear apart the source code from the repository , if there are any suggestions and improvements - make comments in the comments or send to the repository in the form of pull requests . Enjoy your work with modern web technologies!
Source: https://habr.com/ru/post/127994/
All Articles