Google Crome extension for monitoring TeamCity builds
The guys from JetBrains delight us with their wonderful Continuous Integration Server TeamCity . One of the main tasks of such a server is very fast feedback, with which TeamCity copes wonderfully. There are many notifiers in the box (IntelliJ Platform plugin, Windows Tray Notifier, Addin for Visual Studio, Eclipse Plugin, Syndication Feed) and this is enough for programmers. Our testing department has no desire to run Idea and similar “scary things” in order to see the build status.
Since we mainly have web projects and testers using 60% of their working time using a browser, it would be logical to try to write a small extension for monitoring assemblies.
The extension itself, like its code, does not claim a premium.
Sources + package
')
The basic idea is that we are polling the CI server for the status of assemblies and in the case of broken ones we draw a red number next to the extension icon, which will undoubtedly attract attention. Everything is quite simple.
manifest.json. Here everything is standard
The next step is to create a settings page for the options.html extension.
Further we write the handler of settings options.js
Popup handler by clicking on the extension icon
The background.js file does a lot of work. I don't see any point in bringing him here. Since it is big enough. And the more it is in the source.
Let me just say that one of his tasks is to receive statistics even with broken builds and notify the user about this event.
Now let's proceed directly to the settings of the assemblies for display in our extension. To do this, you need to log in to Team City with administrator rights, go into editing the basic settings of the assembly that you want to display, and in the “Build options” section, tick the enable status widget menu. Well, now you can monitor the status of our assemblies, without being distracted by reading habrahabr!
This is what the settings page looks like.

And so popup window
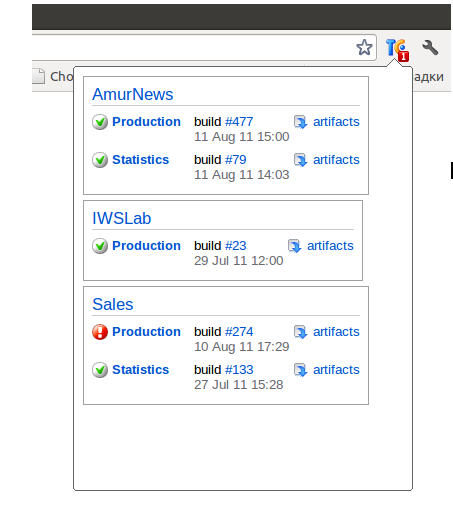
We see that one assembly is broken: (
Also in the pop-up window posted links to artifacts for quick download.
We accept any criticism and suggestions.
ps Thank you very much to our tester Artem Tyurin, who wrote this extension.
Since we mainly have web projects and testers using 60% of their working time using a browser, it would be logical to try to write a small extension for monitoring assemblies.
The extension itself, like its code, does not claim a premium.
Sources + package
')
The basic idea is that we are polling the CI server for the status of assemblies and in the case of broken ones we draw a red number next to the extension icon, which will undoubtedly attract attention. Everything is quite simple.
manifest.json. Here everything is standard
{ "background_page": "background.html", "browser_action": { "default_icon": "images/icon19.png", "default_title": "TeamCity Checker", "popup": "popup.html" }, "description": "Team City Checker Extension", "icons": { "128": "images/icon128.png", "16": "images/icon16.png", "32": "images/icon32.png", "48": "images/icon48.png" }, "name": "TeamCity Checker", "options_page": "options.html", "permissions": [ "http://*/", "tabs" ], "version": "1.1" } The next step is to create a settings page for the options.html extension.
<html> <head> <title>TeamCity Checker</title> <meta http-equiv="Content-Type" content="text/html; charset=UTF-8" > <meta http-equiv="Content-Language" content="ru-RU" > <script type="text/javascript" src="js/jquery.js"></script> <script type="text/javascript" src="js/options.js"></script> </head> <body onload="restore_options()"> <table> <tr> <td><img src="images/icon128.png" style="width:64px" /></td> <td style="padding-left:15px;"> URL TeamCity Server ( , http://192.168.0.2:8111):<br /> <input id="server" type="text" style="width:500px" value="" /> <br /> Timeout: <br /> <select id="timeout"> <option value="5">5 sec.</option> <option value="10" selected>10 sec.</option> <option value="15">15 sec.</option> <option value="30">30 sec.</option> <option value="60">60 sec.</option> </select> <br /> <button onclick="save_options()"></button> </td> </tr> </table> </body> </html> Further we write the handler of settings options.js
function save_options() { localStorage["server"] = $("#server").val(); localStorage["timeout"] = $("#timeout").val(); chrome.extension.getBackgroundPage().init(); } function restore_options() { var server = localStorage["server"], timeout = localStorage["timeout"]; if (!server) return; $("#server").val(server); $("#timeout [value='" + timeout + "']").attr("selected", "selected"); } Popup handler by clicking on the extension icon
function iResize() { var iFrames = $('iframe'); for (var i = 0, j = iFrames.length; i < j; i++) { iFrames[i].style.height = iFrames[i].contentWindow.document.body.offsetHeight + 250 + 'px'; iFrames[i].style.width = iFrames[i].contentWindow.document.body.offsetWidth + 20 + 'px'; } } function loading() { var server = localStorage["server"]; if (server) { if(server[server.length - 1] != "/") server = server + "/"; jQuery('#status').html(jQuery('<iframe\>').attr({'src': server + 'externalStatus.html?withCss=true', 'height':'auto', 'scrolling':'yes', 'frameborder':'0'})); iResize(); } } The background.js file does a lot of work. I don't see any point in bringing him here. Since it is big enough. And the more it is in the source.
Let me just say that one of his tasks is to receive statistics even with broken builds and notify the user about this event.
Now let's proceed directly to the settings of the assemblies for display in our extension. To do this, you need to log in to Team City with administrator rights, go into editing the basic settings of the assembly that you want to display, and in the “Build options” section, tick the enable status widget menu. Well, now you can monitor the status of our assemblies, without being distracted by reading habrahabr!
This is what the settings page looks like.
And so popup window
We see that one assembly is broken: (
Also in the pop-up window posted links to artifacts for quick download.
We accept any criticism and suggestions.
ps Thank you very much to our tester Artem Tyurin, who wrote this extension.
Source: https://habr.com/ru/post/127734/
All Articles