Amazon ElastiCache small review - does it need a typical web project?
 On August 22, Amazon announced a new service in AWS - Amazon ElastiCache. On Habré about this, too, wrote .
Service compatible protocol with Memcached.
Let's see how it works and whether it has practical value for web developers and system administrators.
')
To get started, you need to select the ElastiCache item in the AWS administrative interface and specify the details of your bank card with which payment will be made.
After that, you can proceed to the actual launch.

Please note - the service is currently available only in one of five regions, in the US East (Virginia).
The key concept of ElastiCache is Cache Cluster.
Inside the cluster, you can start (manually or automatically) the required number of nodes.
Starting a new cluster, we set its parameters:
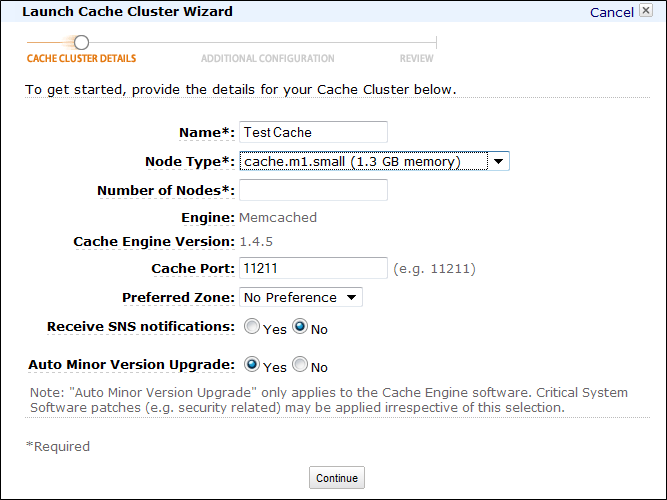
Important points:
- Node Type - the physical characteristics of each node in the cluster (RAM, CPU). In the same cluster, all nodes must be of the same configuration! Only their number will vary.
- Engine - in fact, it’s not just protocol compatibility with memcached, and that’s what is - memcached itself. Perhaps in the future there will be some other options.
Further we set Security Group and Cache Parameter Group .
Cache Parameter Group so far (?) Is the only one and so far (?) Is not configured.
On setting up the Security Group I want to stop a little more.
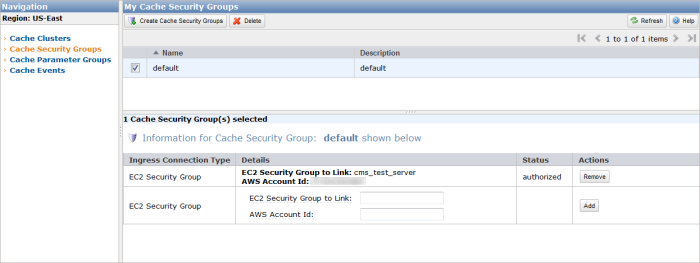
In the group settings, the name of the Security Group for EC2 is indicated - those virtual machines that will have access to the cache cluster nodes.
And also AWS Account ID.
Some "thin" moments:
- In EC2 Security Group it is the name of the group that is indicated, and not the identifier of the form sg- * (as I myself first thought). If you specify any incorrect data, in most cases there will not even be any intelligible error message.
The fact that it is necessary to indicate the name of the group more or less clearly follows only from the API description:
elasticache.us-east-1.amazonaws.com
?Action=AuthorizeCacheSecurityGroupIngress
& EC2SecurityGroupName =default
&CacheSecurityGroupName=mygroup
&EC2SecurityGroupOwnerId=1234-5678-1234
&Version=2011-07-15
&SignatureVersion=2
&SignatureMethod=HmacSHA256
&Timestamp=2011-02-12T01%3A29%3A15.746Z
&AWSAccessKeyId=YOUR-ACCESS-KEY
&Signature=YOUR-SIGNATURE- Since all firewall management is carried out at the EC2 Security Group level, you will not be able to open access to Amazon ElastiCache from arbitrary networks. That is, you can work with this service only from other Amazon services (in general, EC2).
- Since not only EC2 Security Group is indicated, but also AWS Account ID, it is possible to give access from another account.
As a result, after all the settings have been made, the required number of cache cluster nodes is launched (I experimented with one node). EndPoint is defined for each node - just a pair of host: port that our application can access.
* * *
We turn to practical tests! :)
For the experiments, I took two CMS: the most popular commercial - 1C-Bitrix, and the most popular open source - Joomla (data on popularity - from the iTrack rating ).
Bitrix
To use memcache as storage for the cache, you can use two options:
1. Specify in the dbconn.php configuration file:
define("BX_CACHE_TYPE", "memcache");
define("BX_MEMCACHE_HOST", "testcache.lfffta.0001.use1.cache.amazonaws.com");
define("BX_MEMCACHE_PORT", "11211");
2. Alternatively (only on older editions of “Web Cluster” and “Business Web Cluster”) specify the required number of memcached servers in the administrative interface in the product settings (plus this method in that any number of servers can be specified, and not one that allows you to use a distributed cache):

For tests on the EC2 virtual machine (small), a demo version of “1C-Bitrix” 10.0 is installed with sample content from the distribution kit (“Online Store”). The machine is deployed in the same AZ (Availability Zone), in which our Cache Cluster is raised - to minimize the impact of the network.
Since we do not need a large detailed test, and we only want to evaluate the speed of the project when using Amazon ElastiCache, I did not use full-fledged tools for load testing (such as tsung or JMeter), but limited myself to simple ab.
We make 500 requests in 2 threads (I’ll say right away that I ran the tests several times to get average values).
According to the method of testing someone may have comments. I will note once again - I compare only two things: the work of sites without using Amazon ElastiCache and with it. Absolute numbers are not interesting, only relative data.
# ab -n 500 -c 2 ec2-xx-xx-xx-0.compute-1.amazonaws.comThe first test is using the standard cache (disk is the EC2 virtual machine file system):
  Document Path: /
 Document Length: 25910 bytes

 Concurrency Level: 2
 Time taken for tests: 53.748 seconds
 Complete requests: 500
 Failed requests: 0
 Write errors: 0
	 Total transferred: 13324000 bytes
	 HTML transferred: 12955000 bytes
	 Requests per second: 9.30 [# / sec] (mean)
 Time per request: 214.993 [ms] (mean)
 Time per request: 107.497 [ms] (mean, across all concurrent requests)
 Transfer rate: 242.09 [Kbytes / sec] received

 Connection Times (ms)
               min mean [+/- sd] median max
 Connect: 0 0 0.8 0 19
 Processing: 51 215 313.9 197 5090
 Waiting: 51 215 313.9 196 5090
 Total: 51 215 313.9 197 5090
9.3 requests per second
We connect ElastiCache and do new tests:
  Concurrency Level: 2
 Time taken for tests: 67.987 seconds
 Complete requests: 500
 Failed requests: 0
 Write errors: 0
 Total transferred: 13323973 bytes
 HTML transferred: 12954973 bytes
 Requests per second: 7.35 [# / sec] (mean)
 Time per request: 271.947 [ms] (mean)
 Time per request: 135.973 [ms] (mean, across all concurrent requests)
 Transfer rate: 191.39 [Kbytes / sec] received

 Connection Times (ms)
               min mean [+/- sd] median max
 Connect: 0 0 0.0 0 0
 Processing: 114 272 101.1 279 1293
 Waiting: 114 272 101.1 279 1293
 Total: 114 272 101.1 279 1293
7.35 requests per second
Slower!
The local disk cache works more efficiently than memcached, with which we “communicate” via TCP / IP. (I’ll note at once that locally raised memcached is also faster on the same machine.)
* * *
Look at Joomla
Conditions for tests are similar - to the EC2 virtual machine (also small, in the same AZ) we put Joomla 1.7 with a sample demo content.
Run the test - the same ab:
  Concurrency Level: 2
 Time taken for tests: 107.028 seconds
 Complete requests: 500
 Failed requests: 0
 Write errors: 0
 Total transferred: 8247000 bytes
 HTML transferred: 8068000 bytes
 Requests per second: 4.67 [# / sec] (mean)
 Time per request: 428.110 [ms] (mean)
 Time per request: 214.055 [ms] (mean, across all concurrent requests)
 Transfer rate: 75.25 [Kbytes / sec] received

 Connection Times (ms)
               min mean [+/- sd] median max
 Connect: 0 0 0.0 0 0
 Processing: 159 428 797.5 388 17777
 Waiting: 159 428 797.5 388 17777
 Total: 159 428 797.5 388 17777
4.67 requests per second
Somehow slowly ...
Go to the admin area and see that caching is turned off by default.
It can be enabled, there are two modes - conservative and progressive.
We use standard storage - file system. In the first case, 6.6 requests per second are obtained, in the second - 7.2 :
  Concurrency Level: 2
 Time taken for tests: 69.440 seconds
 Complete requests: 500
 Failed requests: 0
 Write errors: 0
 Total transferred: 8036000 bytes
 HTML transferred: 7857000 bytes
 Requests per second: 7.20 [# / sec] (mean)
 Time per request: 277.761 [ms] (mean)
 Time per request: 138.880 [ms] (mean, across all concurrent requests)
 Transfer rate: 113.01 [Kbytes / sec] received

 Connection Times (ms)
               min mean [+/- sd] median max
 Connect: 0 0 0.7 0 17
 Processing: 123 277 72.3 267 852
 Waiting: 123 277 72.4 267 852
 Total: 123 277 72.3 267 852
We connect for storage of memcache.
Generally speaking, as conceived by Joomla developers, this can be done through the administrative interface.
However, the ability to basically use memcache is checked by this code:
public static function test()
{
if ((extension_loaded('memcache') && class_exists('Memcache')) != true ) {
return false;
}

$config = JFactory::getConfig();
$host = $config->get('memcache_server_host', 'localhost');
$port = $config->get('memcache_server_port', 11211);

$memcache = new Memcache;
$memcachetest = @$memcache->connect($host, $port);

if (!$memcachetest) {
return false;
} else {
return true;
}
}
If the test function returns false, memcache will not be in the menu for selecting storage.
That is, for the initial indication of the connection parameters, we need to either explicitly set the parameters in the configuration.php configuration file, or run the “default” memcached (localhost: 11211).
Specify in configuration.php:
public $memcache_persist = '1';
public $memcache_compress = '0';
public $memcache_server_host = 'testcache.lfffta.0001.use1.cache.amazonaws.com';
public $memcache_server_port = '11211';
Testing:
  Concurrency Level: 2
 Time taken for tests: 140.928 seconds
 Complete requests: 500
 Failed requests: 3
    (Connect: 0, Receive: 0, Length: 3, Exceptions: 0)
 Write errors: 0
 Non-2xx responses: 3
 Total transferred: 8002436 bytes
 HTML transferred: 7823370 bytes
 Requests per second: 3.55 [# / sec] (mean)
 Time per request: 563.712 [ms] (mean)
 Time per request: 281.856 [ms] (mean, across all concurrent requests)
 Transfer rate: 55.45 [Kbytes / sec] received

 Connection Times (ms)
               min mean [+/- sd] median max
 Connect: 0 0 0.0 0 0
 Processing: 142 563 397.1 461 3942
 Waiting: 142 563 397.1 460 3942
 Total: 142 564 397.1 461 3942
3.55 requests
Expected - slower. :(
But unexpectedly - even slower than without using a cache at all. :(
At once I will say that in the end I tried to take another Cache Cluster for tests, with more powerful cache nodes. Got an extra small performance boost compared to the "test sample".
* * *
We summarize
In short, for medium-sized projects (most of which), Amazon ElastiCache does not make much sense at the moment ... :(
- Configuration is comparable (if not more difficult) with setting up a local memcached on the same (or other) instance.
- The price is comparable to EC2 (small ElastiCache 1.3 GB - $ 0.095 per hour, small EC2 1.7 GB - $ 0.085 per hour).
- Can only be used with other AWS services.
- Separate EndPoint for each node (and not for the entire Cache Cluster as a whole) allow you to use scaling features, etc. only in those products in which you can connect more than one memcached server (as, for example, in the same 1C-Bitrix web cluster).
When it is possible, necessary and useful to use ElastiCache:
- On large projects where a huge (and - importantly - scalable both upward and downward) cache is required. ElastiCache allows you to use a very large number of different metrics in CloudWatch (from the amount of transferred data and hits to CPU Utilization and the amount of used / unused memory) by which you can set certain rules for automatic scaling.
- In those projects where the availability of cache servers is critical (ElastiCache monitors the status of the cache cluster nodes and automatically restores them in case of any problems).
Generally speaking, of course, Amazon is moving in the right direction, providing more and more "cloud" services. The more choice the user has, the better.
Well, with ElastiCache, I hope, over time, it will be possible to work faster and cheaper.
Source: https://habr.com/ru/post/127602/
All Articles