Information theory in the problem of testing the hypothesis of independence of values taken by a random variable, for example, the DJI index
Let us try to test the hypothesis of whether the increments of the values of the DJI index are statistically independent. At the same time, as a reference source of data with which we will make a comparison, we take an artificial time series generated from the actual increments of the original series, but at the same time randomly mixed. As a measure of statistical independence, we use statistics of mutual information.
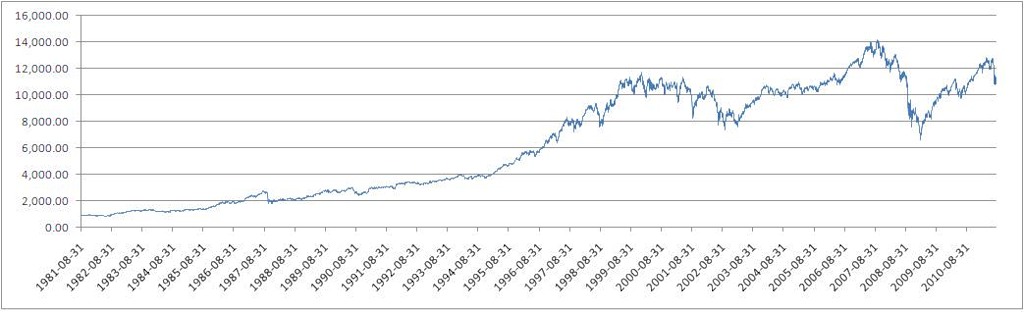
As an experimental data source, we take the data from the DJI for 30 years (daily closing prices), from 1981-08-31 to 2011-08-26 (Source: finance.yahoo.com ).
')
Dow Jones Industrial Average (DJI) Index Values
The number of percentage increments of quotes calculated by the formula X [t] / X [t-1] - 1
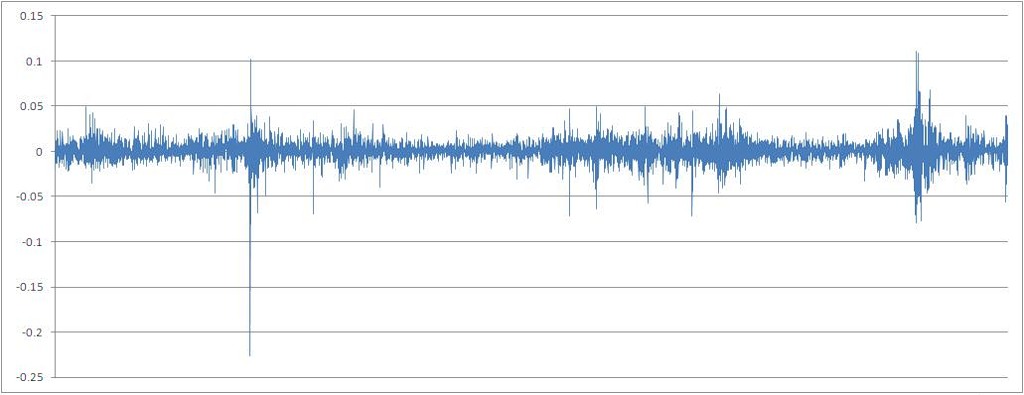
To bring the investigated continuous, in its essence, variable to a discrete type, we proceed to a series of percentage increments, rounded to 0.01 (1%). Counting mutual information for continuous variables, although technically possible, but not informative, due to the very large value of n - a finite set of values of the characteristic taken by a random variable.

(All formulas and theory are borrowed from: ru.wikipedia.org as well as from a number of monographs that can be searched by keywords.)
The theory of information has evolved inextricably with the theory of communication, I will not deviate from this tradition.
Imagine that there is a data transmitter and receiver. The transmitter transmits a discrete variable X, which accepts a limited number of possible values of x (this is also called the alphabet). The probability of the implementation of each specific value differs from zero, otherwise this value is simply excluded from the analysis. The form of the probability density function on the space of values accepted by a variable can be arbitrary. The sum of all probabilities for each possible value is 1 (if the sum is 0, then the further course of thoughts does not make sense).
The receiver perceives the transmitted values of X, or it can be said that an event occurs at the point of reception of values — the variable X has assumed the value x. And the less we, that is, the observers, know what kind of event will occur (that is, what value the receiver will take), the more entropy this system has, and the more information the implementation of this event will bring.
Hence, informational entropy (concepts borrowed from entropy in theoretical physics) is a quantitative measure of uncertainty in an abstract system consisting of the possibility of realizing an event and its direct implementation. Hmm, sounds really abstract. But this is also the strength of this theory: it can be applied to the widest class of phenomena.
But what is information? It is also a quantitative measure characterizing the amount of entropy, or uncertainty, that has left the system during the implementation of a specific event. Information, therefore, is quantitatively equal to entropy.
If they talk about the whole range of values that are implemented in the system, then they talk about average information or informational entropy. This value is calculated by the formula:

If they talk about the information of a single implementation of a random variable, they talk about their own information:

For example, an experiment with multiple fair coin popping is a system with an average information equal to 1 Bit (when substituting the base 2 logarithm into the formula). At the same time, before each flip we expect a tail or an eagle with equal probability (these events are independent from each other) and the uncertainty is always 1. And what will be the information entropy of this system with an unequal probability of falling sides of a coin? Say, the eagle falls with a probability of 0.6, and tails - with a probability of 0.4. Calculate and get: 0.971 bits. The entropy of the system has decreased, since the uncertainty of the experiment is less: we expect the eagle more often than tails.
Returning to the example of the transmitter and receiver, if the connection between them is ideally good, then the information (in a broad sense) will always be transmitted 100% correct. In other words, the mutual information between the transmitter and the receiver will be equal to the average information of the receiver itself (symbolizing the realization of the event), and if the data from the transmitter is not related to the data received by the receiver, then the mutual information between them will be equal to 0. In other words, The transmitter transmits nothing about what the receiver is receiving. If there is some loss of information, the mutual information will be from 0 to the average receiver information.

In the context of the task about which I wrote in this article, mutual information is a tool for finding an arbitrary type of dependence between a receiver (dependent variable) and a transmitter (independent variable). The maximization of mutual information between a pair of variables indicates the presence of a certain determinism of the implementation of a random value in relation to its past implementations. You can, of course, take anything as independent variables, from the composition of singing birds in the morning to the frequency of certain words in online publications on the topic of stock trading. "The truth is somewhere near."
So, we calculate the entropy of the data source (http://ru.wikipedia.org/):
The average information (or just entropy) of this data source (calculated from the logarithm with base 2) is 2.098 bits.
Mutual information between random variables is calculated through the concept of informational entropy (http://ru.wikipedia.org/):
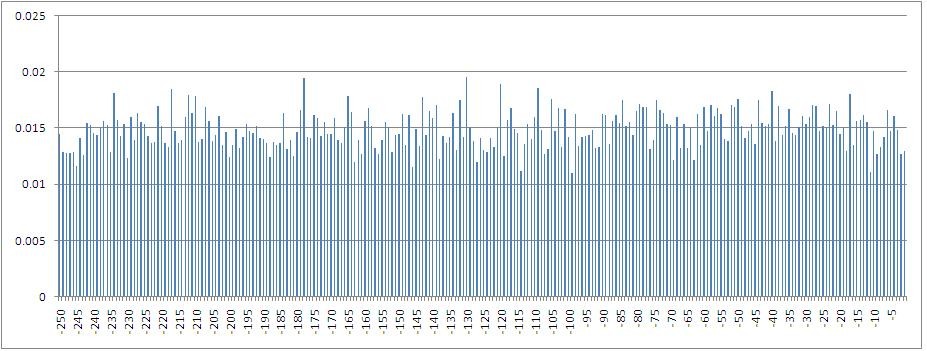
A histogram of mutual information values between the dependent variable — the percentage increment of the index calculated by the closing prices — and its values with a shift from 1 to 250 steps back in time.
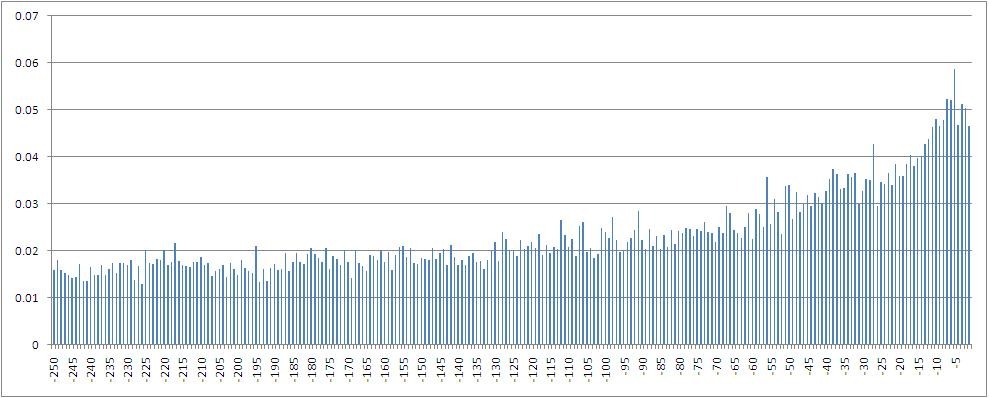
In particular, it can be seen that the maximum mutual information is calculated with a variable with a lag of 5, that is, with a value having a place one trading week ago. Also, it is obvious that the amount of mutual information decreases when immersed in the lag space.
The type of probability density distribution function for the obtained set of values of the quantity of mutual information:

Generate an artificial time series for reference purposes. The source of a series of integers that specify the sequence of values of the attribute was selected site www.random.org . According to the information on the site, they provide really random numbers (unlike PRNG, a pseudo-random number generator).
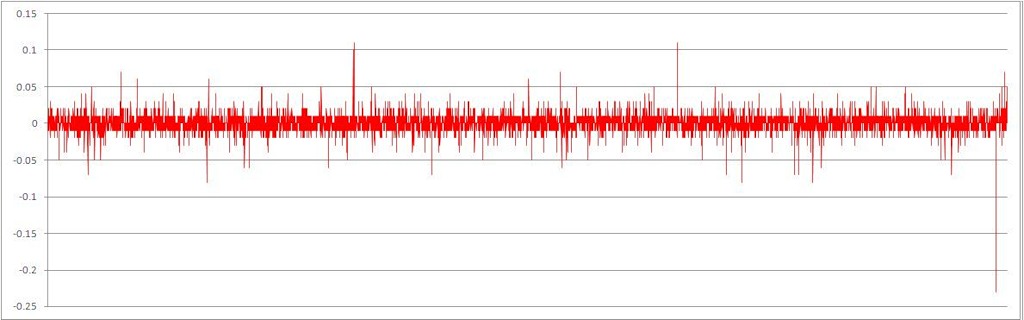
The resulting series of increments, with randomly mixed chronological order

By eye, one can note how much more stationary the data has become.
The same row with rounded values.
The histogram of mutual information values between the dependent variable and its values with a shift from 1 to 250 steps back in time along an artificial time series of increments (while maintaining the same type of probability density function on the space of feature values)
Type of probability density distribution function for a given sample:

Comparison of 2 considered cases of mutual information calculation

You can see by how much different samples of the values of the amount of mutual information are different.
Let us test the hypothesis about the significance of the difference (the difference in the form of the probability density function of the two) of two samples of calculated values of mutual information - for the original and artificial time series. Using non-parametric tests, we calculate the statistics using the Kolmogorov-Smirnov method (the Kolmogorov-Smirnov test is used to compare two independent samples of values in order to determine the statistical significance of the differences between sample values. The U-test of Mann and Whitney is used for the same purpose).
Result: p = 0.00 at the accepted threshold level of significance of 0.05.
The result of the U-test by the method of Mann and Whitney: p = 0.00.
We see that in both cases the hypothesis about the difference between the samples of the characteristic values is accepted (p is less than 0.05).
It can be concluded that in the natural financial data (at least the DJI index) there are statistically significant dependencies of an arbitrary type between increments of quotations. That is, such a series of data can not be considered random. Theoretically, there is a space of possibilities for predicting the future values of such a series, for example, using neural networks.
PS: I would welcome comments, criticism.
As an experimental data source, we take the data from the DJI for 30 years (daily closing prices), from 1981-08-31 to 2011-08-26 (Source: finance.yahoo.com ).
')
Dow Jones Industrial Average (DJI) Index Values
The number of percentage increments of quotes calculated by the formula X [t] / X [t-1] - 1
To bring the investigated continuous, in its essence, variable to a discrete type, we proceed to a series of percentage increments, rounded to 0.01 (1%). Counting mutual information for continuous variables, although technically possible, but not informative, due to the very large value of n - a finite set of values of the characteristic taken by a random variable.
Basic concepts of information and theoretical ideas used in the article
(All formulas and theory are borrowed from: ru.wikipedia.org as well as from a number of monographs that can be searched by keywords.)
The theory of information has evolved inextricably with the theory of communication, I will not deviate from this tradition.
What is information?
Imagine that there is a data transmitter and receiver. The transmitter transmits a discrete variable X, which accepts a limited number of possible values of x (this is also called the alphabet). The probability of the implementation of each specific value differs from zero, otherwise this value is simply excluded from the analysis. The form of the probability density function on the space of values accepted by a variable can be arbitrary. The sum of all probabilities for each possible value is 1 (if the sum is 0, then the further course of thoughts does not make sense).
The receiver perceives the transmitted values of X, or it can be said that an event occurs at the point of reception of values — the variable X has assumed the value x. And the less we, that is, the observers, know what kind of event will occur (that is, what value the receiver will take), the more entropy this system has, and the more information the implementation of this event will bring.
Hence, informational entropy (concepts borrowed from entropy in theoretical physics) is a quantitative measure of uncertainty in an abstract system consisting of the possibility of realizing an event and its direct implementation. Hmm, sounds really abstract. But this is also the strength of this theory: it can be applied to the widest class of phenomena.
But what is information? It is also a quantitative measure characterizing the amount of entropy, or uncertainty, that has left the system during the implementation of a specific event. Information, therefore, is quantitatively equal to entropy.
If they talk about the whole range of values that are implemented in the system, then they talk about average information or informational entropy. This value is calculated by the formula:
If they talk about the information of a single implementation of a random variable, they talk about their own information:
For example, an experiment with multiple fair coin popping is a system with an average information equal to 1 Bit (when substituting the base 2 logarithm into the formula). At the same time, before each flip we expect a tail or an eagle with equal probability (these events are independent from each other) and the uncertainty is always 1. And what will be the information entropy of this system with an unequal probability of falling sides of a coin? Say, the eagle falls with a probability of 0.6, and tails - with a probability of 0.4. Calculate and get: 0.971 bits. The entropy of the system has decreased, since the uncertainty of the experiment is less: we expect the eagle more often than tails.
Returning to the example of the transmitter and receiver, if the connection between them is ideally good, then the information (in a broad sense) will always be transmitted 100% correct. In other words, the mutual information between the transmitter and the receiver will be equal to the average information of the receiver itself (symbolizing the realization of the event), and if the data from the transmitter is not related to the data received by the receiver, then the mutual information between them will be equal to 0. In other words, The transmitter transmits nothing about what the receiver is receiving. If there is some loss of information, the mutual information will be from 0 to the average receiver information.
In the context of the task about which I wrote in this article, mutual information is a tool for finding an arbitrary type of dependence between a receiver (dependent variable) and a transmitter (independent variable). The maximization of mutual information between a pair of variables indicates the presence of a certain determinism of the implementation of a random value in relation to its past implementations. You can, of course, take anything as independent variables, from the composition of singing birds in the morning to the frequency of certain words in online publications on the topic of stock trading. "The truth is somewhere near."
So, we calculate the entropy of the data source (http://ru.wikipedia.org/):
The average information (or just entropy) of this data source (calculated from the logarithm with base 2) is 2.098 bits.
Mutual information between random variables is calculated through the concept of informational entropy (http://ru.wikipedia.org/):
A histogram of mutual information values between the dependent variable — the percentage increment of the index calculated by the closing prices — and its values with a shift from 1 to 250 steps back in time.
In particular, it can be seen that the maximum mutual information is calculated with a variable with a lag of 5, that is, with a value having a place one trading week ago. Also, it is obvious that the amount of mutual information decreases when immersed in the lag space.
The type of probability density distribution function for the obtained set of values of the quantity of mutual information:
Generate an artificial time series for reference purposes. The source of a series of integers that specify the sequence of values of the attribute was selected site www.random.org . According to the information on the site, they provide really random numbers (unlike PRNG, a pseudo-random number generator).
The resulting series of increments, with randomly mixed chronological order
By eye, one can note how much more stationary the data has become.
The same row with rounded values.
The histogram of mutual information values between the dependent variable and its values with a shift from 1 to 250 steps back in time along an artificial time series of increments (while maintaining the same type of probability density function on the space of feature values)
Type of probability density distribution function for a given sample:
Comparison of 2 considered cases of mutual information calculation
You can see by how much different samples of the values of the amount of mutual information are different.
Let us test the hypothesis about the significance of the difference (the difference in the form of the probability density function of the two) of two samples of calculated values of mutual information - for the original and artificial time series. Using non-parametric tests, we calculate the statistics using the Kolmogorov-Smirnov method (the Kolmogorov-Smirnov test is used to compare two independent samples of values in order to determine the statistical significance of the differences between sample values. The U-test of Mann and Whitney is used for the same purpose).
Result: p = 0.00 at the accepted threshold level of significance of 0.05.
The result of the U-test by the method of Mann and Whitney: p = 0.00.
We see that in both cases the hypothesis about the difference between the samples of the characteristic values is accepted (p is less than 0.05).
It can be concluded that in the natural financial data (at least the DJI index) there are statistically significant dependencies of an arbitrary type between increments of quotations. That is, such a series of data can not be considered random. Theoretically, there is a space of possibilities for predicting the future values of such a series, for example, using neural networks.
PS: I would welcome comments, criticism.
Source: https://habr.com/ru/post/127394/
All Articles