Installing xDebug on Zend Server 5.1 and Windows 7
I used to install everything from day one. Never used WAMP or Denver. Since PHP / FI, I always set everything apart. Well, of course, and xDebug about which said quite a bit. Just peep for Habra and you will find many articles about what xDebug can do, even profile the finished code that I personally like very much.
But lately, we in the company are building our solutions on the Zend Framework. Which led us to a closer use of other Zend technologies like Zend Server or Zend Studio. I would never have started using WAMP or Denver, but Zend Server is different. It does not install MySQL. Allows you to quickly control PHP by turning extensions on and off, or monitoring performance. And this is really a powerful tool, but it's not about him.
Not everyone likes the built-in Zend Debug mechanism that comes with Zend Server as the default debugging tool. Therefore, I decided to replace it with my usual xDebug. But I was surprised that I had to spend a lot of time installing xDebug on Zend Server. And although Google gives a huge number of articles on how to do it, nevertheless, I had to read several of them, and spend almost 1 hour on what it would take 5-10 minutes. That is why I decided to cover this topic in detail.
')
1. Downloading xDebug extension for PHP
At this stage it is important to understand what exactly you need to download. When downloading, consider the following data
* This should be VC9 for Windows 7
* The extension must not contain TS in the name
* The file name must have the version of PHP installed on your Zend Server. This is 5.2 or 5.3
* Even if you have a 64-bit system, Zend Server is still installed as a 32-bit environment. So choose only 32 bits.
You download the file type php_xdebug-2.1.0-5.3-vc9-nts.dll.
2. Save this file to the Zend Server PHP libraries. This is usually a folder.
3. Now you need to disable Zend Debug so that they do not interfere with each other. Actually, I don’t even know whether they will work together, a detailed answer to this question will not only be with the data or not, but also why, I would love to read in the comments.
To disable, open the Zend Debug configuration file and comment out the date in it.
to do this, just put a dot and a comma in front of this line;
This file is usually located here.
4. Now open the file php.ini which is usually located here.
and right in front of the [zend] settings group
Note that this code is not inserted before the line.
as is usually advised, namely before the group of settings indicated by square brackets [zend]
Let me explain what we have done. The first term loads the xDebug extension itself. Do not forget to change the file name but that which you download.
xdebug.profiler_enable - disables continuous profiling. Instead, we will use profiling only individual runs of scripts only when we need it.
xdebug.profiler_output_dir is the path where the profile files will be created, which can then be viewed and analyzed using WinCacheGrind .
xdebug.profiler_enable_trigger - this parameter allows us to enable profiling only if we add the parameter XDEBUG_PROFILE to POST, GET or COOKIE. Look also for FireFox and Chrome, there are extensions that allow you to manage it.
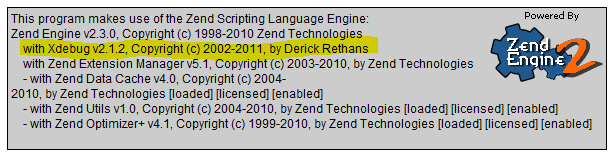
5. It remains only to overload Apache and check in PHP Info that xDebug was loaded successfully.
But lately, we in the company are building our solutions on the Zend Framework. Which led us to a closer use of other Zend technologies like Zend Server or Zend Studio. I would never have started using WAMP or Denver, but Zend Server is different. It does not install MySQL. Allows you to quickly control PHP by turning extensions on and off, or monitoring performance. And this is really a powerful tool, but it's not about him.
Not everyone likes the built-in Zend Debug mechanism that comes with Zend Server as the default debugging tool. Therefore, I decided to replace it with my usual xDebug. But I was surprised that I had to spend a lot of time installing xDebug on Zend Server. And although Google gives a huge number of articles on how to do it, nevertheless, I had to read several of them, and spend almost 1 hour on what it would take 5-10 minutes. That is why I decided to cover this topic in detail.
')
1. Downloading xDebug extension for PHP
At this stage it is important to understand what exactly you need to download. When downloading, consider the following data
* This should be VC9 for Windows 7
* The extension must not contain TS in the name
* The file name must have the version of PHP installed on your Zend Server. This is 5.2 or 5.3
* Even if you have a 64-bit system, Zend Server is still installed as a 32-bit environment. So choose only 32 bits.
You download the file type php_xdebug-2.1.0-5.3-vc9-nts.dll.
2. Save this file to the Zend Server PHP libraries. This is usually a folder.
C:\Program Files\Zend\ZendServer\lib3. Now you need to disable Zend Debug so that they do not interfere with each other. Actually, I don’t even know whether they will work together, a detailed answer to this question will not only be with the data or not, but also why, I would love to read in the comments.
To disable, open the Zend Debug configuration file and comment out the date in it.
zend_extension_manager.dir.debugger="C:\Program Files\Zend\ZendServer\lib\debugger"to do this, just put a dot and a comma in front of this line;
This file is usually located here.
C:\Program Files\Zend\ZendServer\etc\cfg\debugger.ini4. Now open the file php.ini which is usually located here.
C:\Program Files\Zend\ZendServer\etc\php.iniand right in front of the [zend] settings group
[xdebug]
zend_extension="C:\Program Files\Zend\ZendServer\lib\php_xdebug-2.1.2-5.3-vc9-nts.dll"
xdebug.profiler_enable = 0
xdebug.profiler_output_dir = "D:\www\xdebug"
xdebug.profiler_enable_trigger = 1
Note that this code is not inserted before the line.
zend_extension="C:\Program Files\Zend\ZendServer\lib\ZendExtensionManager.dll"as is usually advised, namely before the group of settings indicated by square brackets [zend]
Let me explain what we have done. The first term loads the xDebug extension itself. Do not forget to change the file name but that which you download.
xdebug.profiler_enable - disables continuous profiling. Instead, we will use profiling only individual runs of scripts only when we need it.
xdebug.profiler_output_dir is the path where the profile files will be created, which can then be viewed and analyzed using WinCacheGrind .
xdebug.profiler_enable_trigger - this parameter allows us to enable profiling only if we add the parameter XDEBUG_PROFILE to POST, GET or COOKIE. Look also for FireFox and Chrome, there are extensions that allow you to manage it.
5. It remains only to overload Apache and check in PHP Info that xDebug was loaded successfully.
Source: https://habr.com/ru/post/126645/
All Articles