Quickly create load tests on JMeter for web sites
 For any software application intended for mass service of users, it is necessary to carry out load testing for its reliability and fault tolerance. And since any web site is in its essence a queuing system, testing it for fault tolerance is always an integral part of the development. There are various solutions for load testing web applications. I will not describe them in detail right now, some of them are mentioned here .
In this article I want to share my experience using a tool like Apache JMeter. After I tried with a dozen different similar tools, in the end I stopped at JMeter, since its capabilities more than covered my goals and objectives. And while this software tool is very fast and lightweight.
For those who have never used JMeter, I recommend reading basic reviews, for example, Simple Load Test with Apache JMeter . When I launched this program for the first time, the first thought was to figure out the whole “spear” method, but as it turned out this is unrealistic at all, and the “spear” method is not applicable to JMeter. Therefore, if you want to use it, then immediately open the manual , believe me, you will have to look there very often, until you fully understand what and how. I will now describe the most obvious and important, namely: how to create load tests. If I had once found a similar article in my time, I would have saved almost a day on studying this software.
So let's go! For the sake of interest, let's imagine that we have not just a website, but a serious web application with authorization, various post requests, etc.
')
1. Run JMeter.
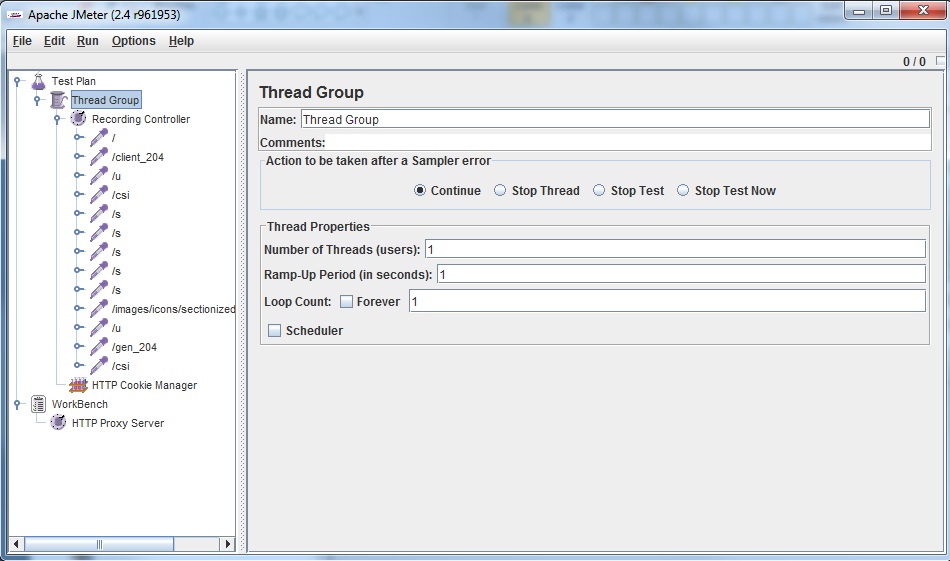
2. Create a thread group:
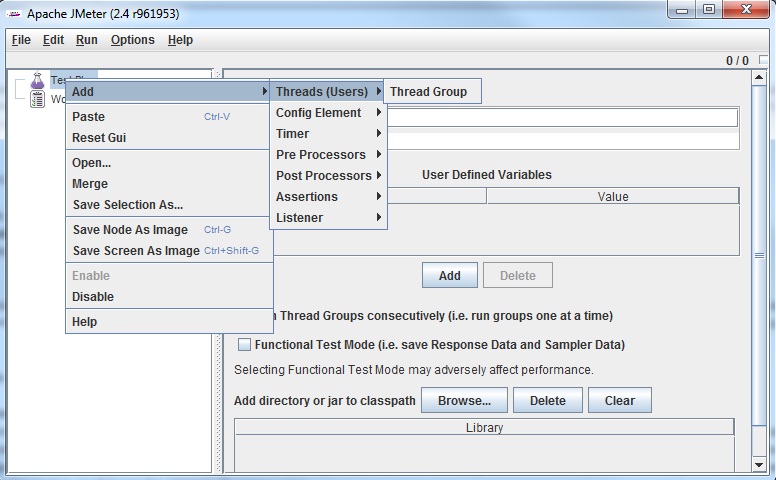
This is our main workflow in which we will write scripts, add various logic and controls.
Now you need to create the actual test script, i.e. a set of different actions to create load on the site. You can create a script manually. It's very simple, for this you need to add the Nth number of HTTP Request elements, which are added so Thread Group -> Add -> Sampler -> HTTP Request. The settings window appears as shown below:
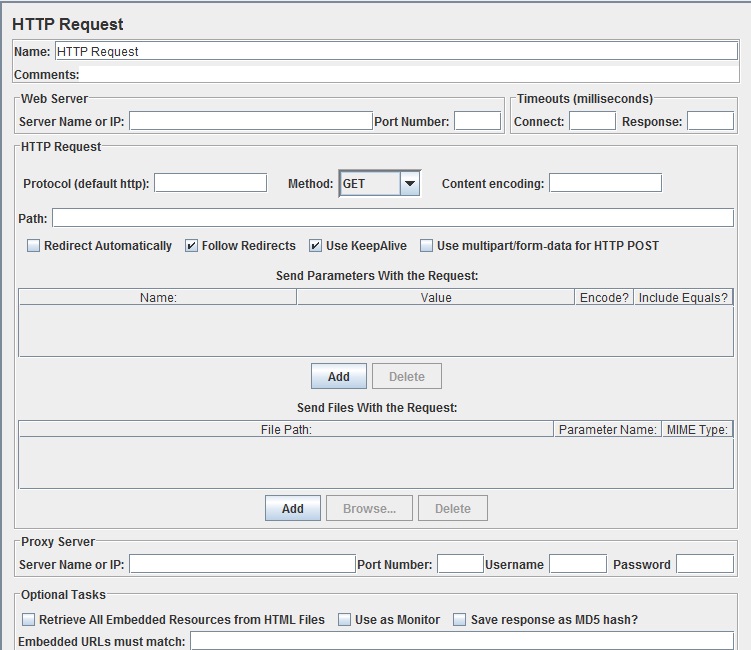
In the appropriate fields set the address of the site, port (if needed), the path to the page. For example:

In addition, you can add parameters for queries. And this way of creating test scripts is quite acceptable for simple sites. However, in our case, it can be tedious to prescribe request parameters for authorization. In addition, there is a need to create a sequence of actions to crawl the site, say, at least 15 pages, then again this option is no longer suitable. Of course, manual labor is not for us, and in an amicable way, this business needs to be automated. In JMeter there is such an opportunity, called recording tests through proxying. Those. we will perform any actions through the browser, and at the same time all the necessary HTTP Request elements will be created without our participation. We look further on the points, how it is done.
3. Add Recording Controller (Thread Group -> Add -> Logic Controller -> Recording Controller). This item will save all our actions that we will do in the browser.
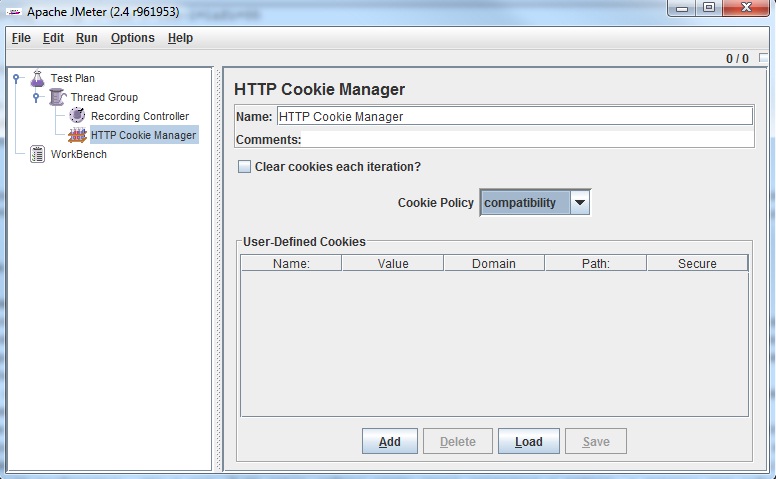
4. Immediately add the HTTP Cookie Manager (Thread Group -> Add -> Config Element -> HTTP Cookie Manager). With the help of this element, work with sessions through cookies will be implemented. In the settings of this item, set the parameter Cookie Policy = compatibility. For the description in the manual. Got such a picture
5. Add HTTP Proxy Server element. You need to add it to the WorkBench section (WorkBench -> Add -> Non-Test Elements -> HTTP Proxy Server), since this element will not participate directly during the testing. We only need it to create test scripts. Here we see a lot of settings for this item:
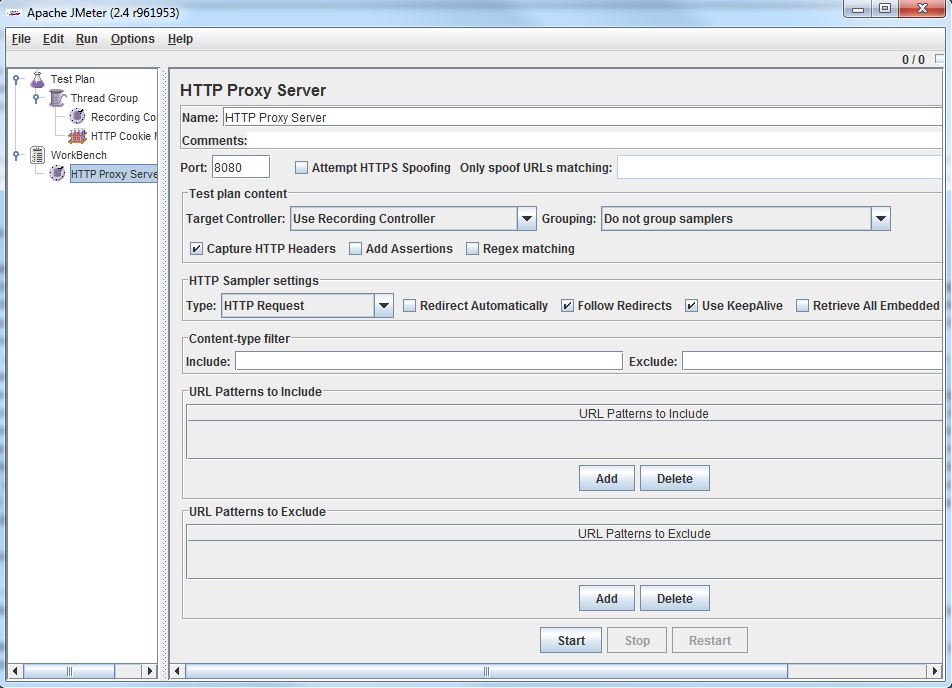
In fact, it’s enough just to change the port number of the proxy server, if the default port 8080 is already taken, for example, you can set 8089. If you leave the Use Recording Controller in the Target Controller column, then all requests going through the proxy will be recorded in The first Recording Controller in our test plan. But since at the moment he is only one there, this option will suit us. Further I recommend to pay attention to the filtering setting. These settings provide ample opportunity to filter queries. These can be individual pages, or for example all js scripts, etc. etc. Again in the manual, they are described quite well.
6. In the browser settings you need to specify the proxy address and port. Make sure that the browser goes to the Internet through it, for this go to any website on the Internet, while the page should not load. Next we have to click the Start button in the window with the HTTP Proxy Server settings, thereby launching our proxy. After that, through the browser, open the page of the test site, log in, perform various actions, visit different pages, and the script will already begin to be stored in the Recording Controller element. When you realize that the script you have written is already severe enough, in order to make your site hot, you stop the proxy.
Received, approximately, the following picture:
The names of the elements may be little talk about. Therefore, in order to continue to simply observe the test, it makes sense to rename these elements.
7. In the settings of the Thread Group, select the number of threads, the number of iterations, the warm-up time. For example, I set the following settings:
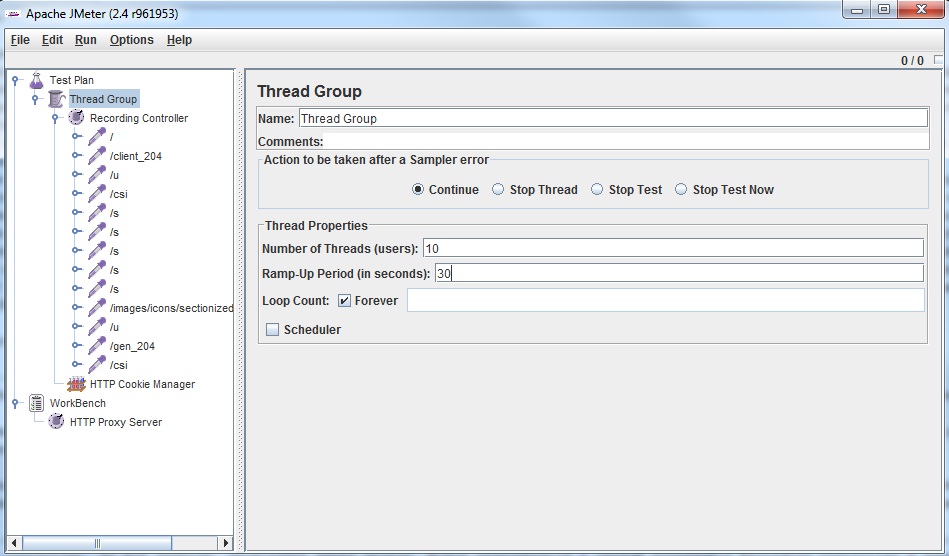
This means that testing will take place in 10 threads, will last indefinitely until it is forcibly stopped. I set the warm-up time for 30 seconds. This means that the threads will start evenly within 30 seconds, i.e. every three seconds, a new thread will be launched.
8. In order to observe the test results, as well as monitor the progress, you need to add several monitoring elements. I usually add these: View Results Tree, View Results in Table, Graph Results, Summary Report. Like what they show, I think you will figure it out. The only thing I will note is a very useful element of View Results Tree, in which you can view all the parameters and the contents of the requests and responses:
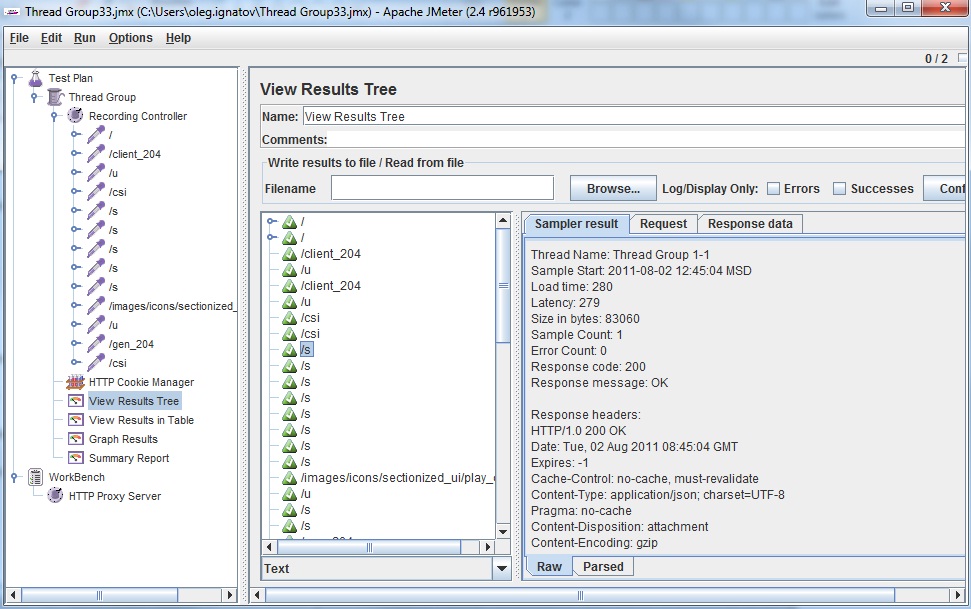
This way you can check that everything works as it should.
That's all! Thus, you can create a load test for your site in minutes.
Finally, I will say a couple of useful features that are implemented in Apach JMeter.
Default settings
If you want to make settings for all HTTP Request elements, this can be done by adding a special set of HTTP Request Defaults settings (Recording Controller -> Add -> Config Element -> HTTP Request Defaults). In appearance, this window is very similar to HTTP Request. All parameters that you specify in it will be used in all other elements of this set. This can be convenient in many situations, for example, when you have several web sites deployed at different ports, and periodically you need to test one or the other. In order not to edit one port for all requests, we change it in just one place in HTTP Request Defaults. All others will use it if they do not have their own.
Load user list from file
This task is also simple and obvious. If you need to set on your long-suffering web resource at once a whole bunch of angry users, who will randomly press all the buttons in a row, this is done by adding the CSV Data Set Config Element -> CSV Data Set element Config).
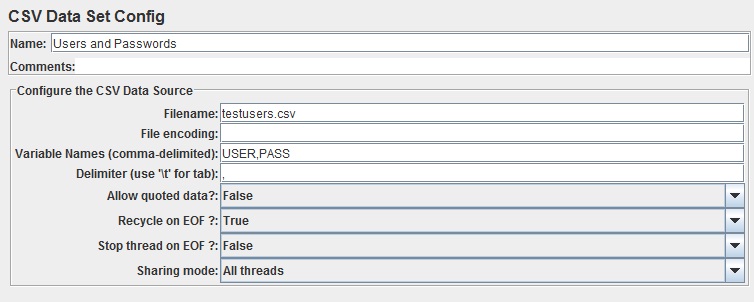
In the window that appears, specify the name, the path to the file (if you put it next to the project file, then it is enough to specify one name), as well as the names of the variables. You set these names yourself; they will be used later in the formation of the request. For example, for the user / password combination, I specified two variable names: USER, PASS.
The csv file itself may look like this:
userName1, pass1
userName2, pass2
userName3, pass3
Great, we gave users the input dzhimetra. Now you need to tell him that he zayuzal them where it is required. This is done so, we are looking for the HTTP Request element that is responsible for authorization. As a rule, it will contain in itself the request parameters, namely: the login and password that you entered when writing the script through the browser. Instead of specific username and password values, we substitute the names of our variables in the following format $ {USER}, $ {PASS}.
It looks like this to me:
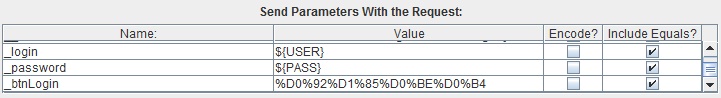
After that, JMeter will cyclically use these credit lines for different streams, thus providing a very realistic load on the site.
That's all, thank you all for your attention!
Source: https://habr.com/ru/post/126042/
All Articles