NetworkX for convenient work with network structures
The NetworkX library intended for the creation, manipulation and study of the structure, dynamics and functioning of complex network structures is considered.
The basics of using the library as a tool for learning, application programming or research are considered.
The basis for the description of the library are official materials from the site.
Reviewed version 1.5 of the library.
Library features
The networkX library is created in Python and is designed to work with graphs and other network structures. This free software is distributed under the new BSD license .
The main features of the library:
- Classes for working with simple, directed and weighted graphs;
- A node can be almost anything: time-series, text, image, XML;
- Saving / loading graphs to / from the most common graph storage file formats;
- Built-in procedures for creating graphs of basic types;
- Methods for detecting subgraphs, click and K-longitudinal graphs (K-core) (the maximum subgraph in which each vertex has at least level K).
- Obtaining such graph characteristics as vertex degrees, graph height, diameter, radius, path length, center, intermediateness, etc .;
- Visualize the network in the form of 2D and 3D graphs;
- And much more…

Performance
It is stated that the library can freely operate with very large network structures, a graph level with 10 million nodes and 100 million arcs between them. In view of the fact that it is based on a low-level data structure of the Python language called
Basic data structures
The library is organized as a hierarchy of packages. The upper level in each package provides general methods for manipulating its structures, the lower ones acquire more and more specialization.
In all the examples that follow, networkX is connected with the following directive:
>>> import networkx as nx ')
Class count
The following main types of graphs are supported:
- Graph is an implementation of a simple undirected graph. Additional vertices between two nodes are ignored; nodes connected to themselves are possible.
- DiGraph - oriented graph, added features and restrictions specific to this type of graphs.
- MultiGraph is the implementation of multigraphs, in such graphs, the possible existence of pairs of vertices that are connected by more than one edge (undirected), or by more than two arcs of opposite directions.
- MultiDiGraph is a correspondingly oriented multigraph.
Examples of creating empty graphs of various types:
>>> G=nx.Graph() >>> G=nx.DiGraph() >>> G=nx.MultiGraph() >>> G=nx.MultiDiGraph() The internal representation of the graphs is implemented as adjacency lists. However, in order to avoid inconsistencies, all operations with graphs should not be performed directly with this list, but using the library's API functions.
Nodes and arcs
The components of any graph. Any node or arc has a unique identifier by which it is possible to obtain all the information associated with it; in addition, there can be names that are more convenient for the implementation of the current algorithm than identifiers that also allow obtaining this data.
Additionally, each node or arc can have any number of attributes that store different types of data. Weighted graphs have a service attribute called “weight” and this name cannot be used to store other information in order to avoid destruction of the internal logic of its presentation.
Creating a graph
At the moment, the graph can be created using one of three methods:
- 1. Graph generator - predefined classes for creating graphs of general topologies, such as complete graphs of various levels, balanced trees, cyclic graphs, Dorogovtsev – Goltsev – Mendez graphs, random binomial and many other types. See the documentation for details: networkx.lanl.gov/reference/generators.html
- 2. Data download and graph formation based on a file or data stream of one of the supported formats:
- 3. Sequential addition of nodes and arcs.
The created graph has both general and type-specific methods.
>>> import networkx as nx >>> G=nx.Graph() >>> G.add_edge(1,2) # = 1 >>> G.add_edge(2,3,weight=0.9) # As the added values can serve data of various types:
>>> import math >>> G.add_edge('y','x',function=math.cos) >>> G.add_node(math.cos) # hashable Arcs can also be added from arrays and data paths:
>>> elist=[('a','b',5.0),('b','c',3.0),('a','c',1.0),('c','d',7.3)] >>> G.add_weighted_edges_from(elist) Getting information about the graph
In addition to creating a graph, you usually need to get information about its nodes, arcs, paths, etc. The main methods for this are getting arrays of nodes and arcs (edges () and nodes () respectively), as well as getting an iterator over nodes and arcs (edges_iter () and nodes_iter () respectively).
Additionally, there are a large number of functions for obtaining more specific information about the graph, for example, nx.triangles (G, n) returns the number of triangles in the graph G in which the vertex n is one of the nodes.
All available functions are described in the documentation section at networkx.lanl.gov/reference/algorithms .
Predefined Algorithms
The library has implemented a large number of algorithms that are typical for working on graphs. Implemented such algorithms as finding the shortest path, search in height and width, clustering, finding the isomorphism of graphs and much more.
For example, Dijkstra’s algorithm for finding the minimum path on a weighted graph is implemented as follows:
>>> G=nx.Graph() >>> e=[('a','b',0.3),('b','c',0.9),('a','c',0.5),('c','d',1.2)] >>> G.add_weighted_edges_from(e) >>> print(nx.dijkstra_path(G,'a','d')) ['a', 'c', 'd'] Graph visualization
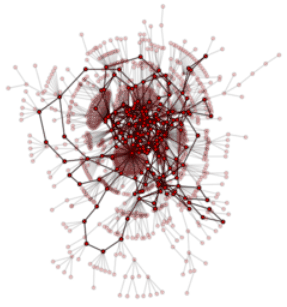
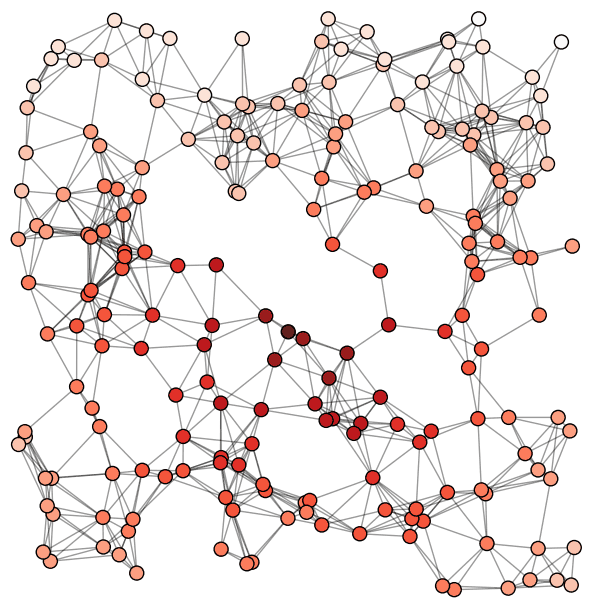
The main purpose of the library is to work with graphs, and their visual display is secondary, but implemented,
Convenient methods are provided for displaying graphs using the Python library of Matplotlib or the Graphviz external module for more complex cases. Full documentation on visualization capabilities is available at networkx.lanl.gov/reference/drawing.html .
A simple graph visualization example:
>>> G=nx.cubical_graph() >>> nx.draw(G) # spring_layout >>> nx.draw(G,pos=nx.spectral_layout(G), nodecolor='r',edge_color='b') Visualization with Matplotlib
Graphviz Visualization

Data structures
The entire internal representation of the graphs uses the dictionary of dictionaries as the main data type. This approach has many advantages. For example, convenient access to nodes using the notation of access to elements of a multidimensional array:
>>> G=nx.Graph() >>> G.add_edge(1,2,color='red',weight=0.84,size=300) >>> print(G[1][2]['size']) 300 More detailed documentation is available at http://networkx.lanl.gov/reference/index. html
I really enjoyed working with this library. Used in a couple of small scripts and I hope to successfully implement in one small study.
Successful projects!
Source: https://habr.com/ru/post/125898/
All Articles