DISLIN - high-level user data visualization library
I think everyone faced the problem of data visualization inside their program. Especially if the program is console. In the topic I want to talk about the free (for non-commercial use) DISLIN cross-platform library, which was developed by the M. Planck Institute for Solar System Research (Germany). DISLIN can either simply display the graphs, or immediately save them to files. The developers claim the possibility of using in fortran, c / c ++, Perl, Python, Java, .NET.
The library supports the following types of displays: VGA, X Windows, Windows API, OpenGL and Tektronix ; and the following file formats are GKSLIN, CGM, HPGL, PostScript, PDF, WMF, SVG, PNG, BMP, GIF, TIFF. At the same time, import of images into TeX is supported, which is good news.
What does DISLIN do?
- Construction of two-and three-dimensional graphs and surfaces.
- Construction of curves, including those given parametrically.
- Elementary operations to build lines, vectors, fields and geometric shapes with different types of fill.
- Work with the text: legend, signatures, etc.
- Construction of two-and three-dimensional histograms and charts.
- Mapping (conventional and contour) in various projections.
- Creating your own GUI.
How to use?
I will show c # as an example. To include DISLIN in your project:
- Add disnet.dll file to “References”. All library calls are collected in the dislin class.
- Add the file dislin.cs to the project.
- Put the dislnc.dll library in the project folder.
// : xwin -
dislin.metafl ( "xwin" );

// DISLIN
dislin.disini ();

//
dislin.titlin ( "3-D Colour Plot of the Function" , 1);
dislin.titlin ( "f(x,y) = sin(x) * cos(y)" , 3);

//
dislin.name ( "X-axis" , "X" );
dislin.name ( "Y-axis" , "Y" );
dislin.name ( "Z-axis" , "Z" );

//
dislin.title ();

//
dislin.ax3len(1000, 1000, 1000);

//
dislin.graf3(0.0f, 360.0f, 0.0f, 90.0f, 0.0f, 360.0f, 0.0f, 90.0f, -2.0f, 2.0f, -2.0f, 1.0f);

// . func
dislin.crvmat(func, n, n, 1, 1);

// DISLIN
dislin.disfin ();

* This source code was highlighted with Source Code Highlighter .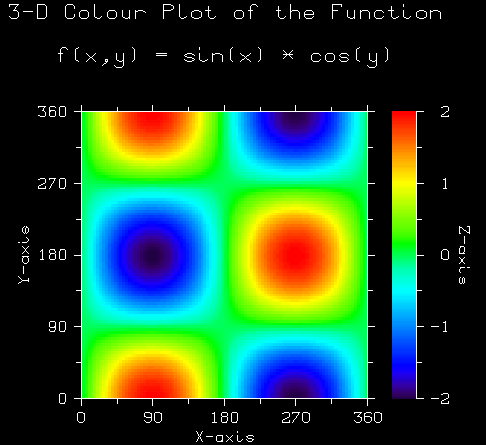
Now we will build the usual two-dimensional graph:
dislin.titlin( "CURVE" , 1);
dislin.titlin( "SIN^2(X), SIN(X) + COS(X)" , 3);

dislin.graf(0.0f, 360.0f, 0.0f, 90.0f, -2.0f, 2.0f, -1.0f, 0.5f);
dislin.title();

// 2
dislin.color( "red" );
dislin.curve(xPoints, func1, n);
dislin.color( "green" );
dislin.curve(xPoints, func2, n);

* This source code was highlighted with Source Code Highlighter .
')
Graph in polar coordinates:
dislin.polar(1.0f, 0.0f, 0.2f, 0.0f, 30.0f);
dislin.curve(xPoint, func, n);
* This source code was highlighted with Source Code Highlighter .
Finally, a three-dimensional surface:
dislin.view3d (-5.0f, -5.0f, 4.0f, "ABS" );
dislin.graf3d (0.0f, 360.0f, 0.0f, 90.0f, 0.0f, 360.0f, 0.0f, 90.0f,
-3.0f, 3.0f, -3.0f, 1.0f);

dislin.color ( "red" );
//
dislin.surmat (func, n, m, 1, 1);

* This source code was highlighted with Source Code Highlighter .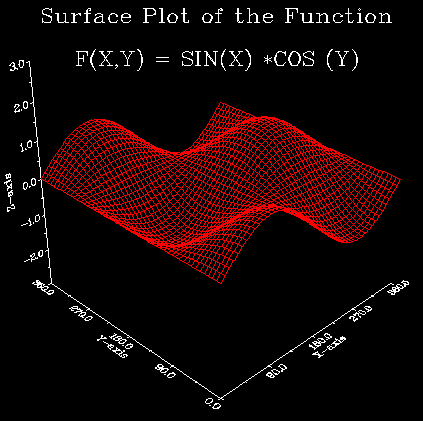
To save the graph to a file immediately, you need to set the desired extension in the metafl function, for example:
dislin.metafl ( "png" );Library cons:
- The figure is static: you cannot rotate the three-dimensional surface or change the scale. Although the projection parameters are customizable.
- No support for Russian language. We have to do the signature in English.
What else to read?
Many examples are given on the official library website: www.mps.mpg.de/dislin/examples.html
You can also view the user gallery .
Developer Presentation: www.mps.mpg.de/dislin/dislin.ppt
Online manual (English): www.mps.mpg.de/dislin/manual.html
Quick reference to features (English): www.mps.mpg.de/dislin/appa.html
Download link (v. 10.1) : www.mps.mpg.de/dislin/downloads.html
By the way, the library DISLIN is 25 years old. The first version was released in December 1986.
Source: https://habr.com/ru/post/125611/
All Articles