Using the Yandex.Metrika API to display statistics
Having read in Habré about the opening of the Yandex API, Metrics wanted to use it on my blog.
Literally at that moment, when I sent the plugin for moderation in wordpress.org, a post appeared on the Habré about a similar module for Drupal .
The main differences are:
Under the cut description of the plugin.
')
The purpose of writing this plugin is the ability to show traffic statistics directly on the pages of the site.
At the moment, graphs of attendance are available by day, by hour, the sex-age structure of visitors and geographic information, a widget that displays the most visited pages. Plans to support all reports available in Yandex.Metrika.
Using this plugin means that you already have your own WordPress site, Yandex account and Yandex.Metrika counter installed.
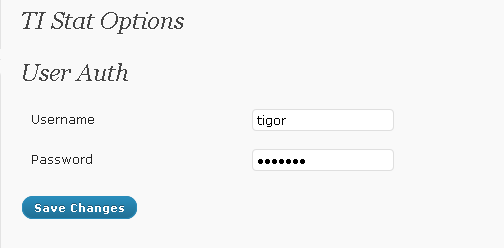
Download and activate the plugin in the WordPress admin panel and go to the Settings -> TI Stat tab.
Here you must enter your username (without yandex.ru) and password. The resulting token is stored in the database, and the username and password are erased.
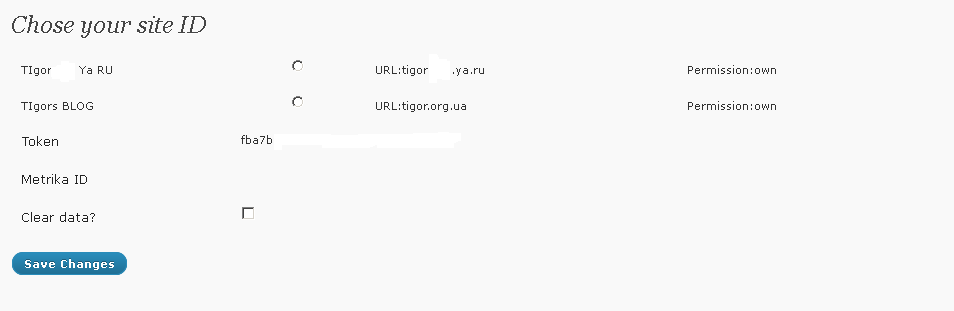
Among the available sites, select the one whose statistics you want to show.
Open any blog page and in the right place insert the code [ystat]. So the graphics on my site look like:
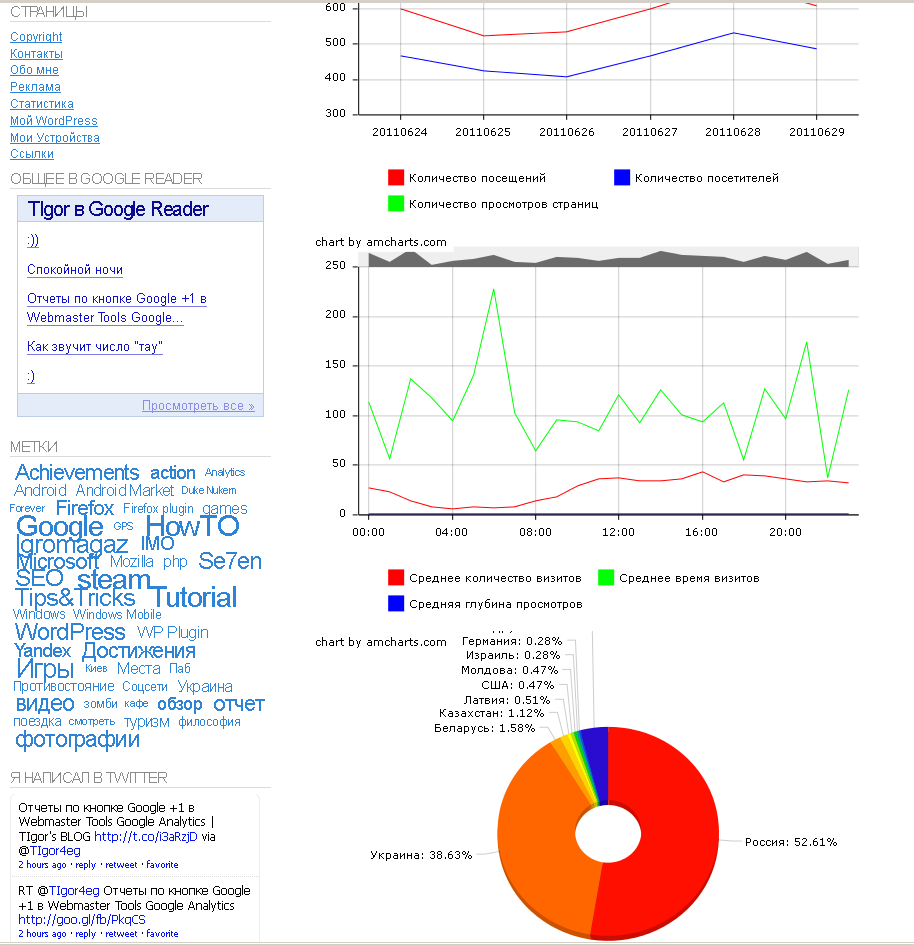
The output of the graphs can be controlled. To do this, insert a shortcode with the charts parameter. for example
[ystat charts = "traffic, hourly, age, gender, countries"]
Also available is a widget that displays the most visited pages.
At the moment, the plugin is far from perfect, but I plan to move it in this direction.
PHP and curl are used to communicate with the Yandex server.
To get a token, authorization by password-name is used, unfortunately authorization through confirmation in Yandex is currently not possible.
For the withdrawal, amCharts shareware charts are used. By the assurances of the developers, they are written in Java-script and fully comply with HTML5.
I tried to describe all graphs as objects, but it turned out to be inexpedient. At the moment, the only valid object is authorization.
At the time of this writing, the plugin has been moderated by wordpress.org and is available for download.
UPD: Now the graphics take data from XML. The time until the new XML generation is set in the admin panel.
The settings for displaying graphs are also stored in XML, in the future it will be possible to change some parameters.
Literally at that moment, when I sent the plugin for moderation in wordpress.org, a post appeared on the Habré about a similar module for Drupal .
The main differences are:
- Use amCharts.
- Getting a token by simply entering a name and password.
- Receive data in XML format.
- Widget most visited pages
Under the cut description of the plugin.
')
The purpose of writing this plugin is the ability to show traffic statistics directly on the pages of the site.
At the moment, graphs of attendance are available by day, by hour, the sex-age structure of visitors and geographic information, a widget that displays the most visited pages. Plans to support all reports available in Yandex.Metrika.
Using this plugin means that you already have your own WordPress site, Yandex account and Yandex.Metrika counter installed.
Customization
Download and activate the plugin in the WordPress admin panel and go to the Settings -> TI Stat tab.
Here you must enter your username (without yandex.ru) and password. The resulting token is stored in the database, and the username and password are erased.
Among the available sites, select the one whose statistics you want to show.
Open any blog page and in the right place insert the code [ystat]. So the graphics on my site look like:
The output of the graphs can be controlled. To do this, insert a shortcode with the charts parameter. for example
[ystat charts = "traffic, hourly, age, gender, countries"]
Also available is a widget that displays the most visited pages.
Development plans
At the moment, the plugin is far from perfect, but I plan to move it in this direction.
- adding new reports
- the ability to change the sample period
- chart settings
- caching creation
Part
PHP and curl are used to communicate with the Yandex server.
To get a token, authorization by password-name is used, unfortunately authorization through confirmation in Yandex is currently not possible.
For the withdrawal, amCharts shareware charts are used. By the assurances of the developers, they are written in Java-script and fully comply with HTML5.
I tried to describe all graphs as objects, but it turned out to be inexpedient. At the moment, the only valid object is authorization.
Conclusion
At the time of this writing, the plugin has been moderated by wordpress.org and is available for download.
UPD: Now the graphics take data from XML. The time until the new XML generation is set in the admin panel.
The settings for displaying graphs are also stored in XML, in the future it will be possible to change some parameters.
Links
Source: https://habr.com/ru/post/124071/
All Articles