Industry Analytics Comparison Bulletin
Last week, many users of Google Analytics received an email, the so-called “Industry Comparison Bulletin”. As it says, this newsletter will come regularly and can be used instead of the old “Comparison” report in your Google Analytics account.
Most likely, this form of material presentation will allow the user to maximize the use of anonymous Google Analytics statistics.
The report provides a summary of all websites whose owners have enabled the sharing of anonymous data in Google Analytics. This newsletter is intended only for those website administrators who have enabled the mode of providing anonymous data . It should be noted that anonymous data provide hundreds of thousands of sites, therefore information can be considered objective and statistically representative for the purposes of web analysis.
The first message of the newsletter says that the statistics is presented for the period from November 1, 2010 to February 1, 2011, the comparison is made with the same period of 2009-2010. The report contains only relative indicators of comparison, absolute indicators, such as the total number of visits, page views and conversions for all websites, unfortunately, are not given.
Site Usage Indicators
Comparing the number of pages viewed per visit in the presented periods, you can see that the average length of time on the site and the bounce rate have decreased.
')

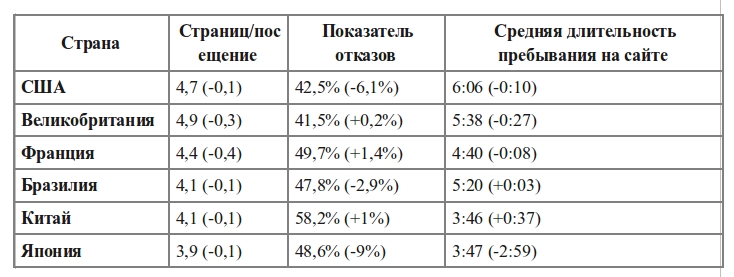
Country Details
Naturally, the structure of the anonymous Google database has the ability to breakdown data by country, which is also an important characteristic for Google Analytics users. Below are summary indicators for some countries. The first value in each cell is the indicator for the period from November 1, 2010 to February 1, 2011. The change in year to year is indicated in brackets (compared to the previous year).
The distribution of the failure rate by country is as follows:
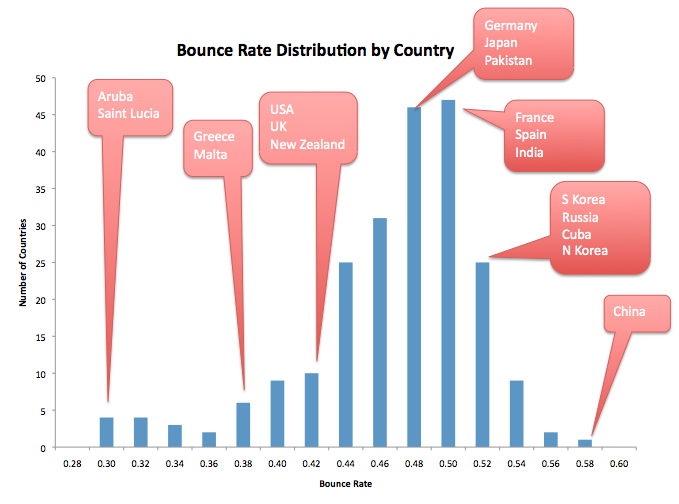
In Russia, while the bounce rate is rather high, this is due to the fact that so far not all are using the web analytics capabilities in practice, which allow to reduce the number of failures on the site.
The diagram shows some countries that are vivid examples of individual groups by level of economic development.
Another important indicator that is associated with the already considered - is the duration of your stay on the site. The chart is below.
On the graph of the duration of stay on the site separately mentioned countries are arranged in reverse order when compared with the diagram of the failure rate.
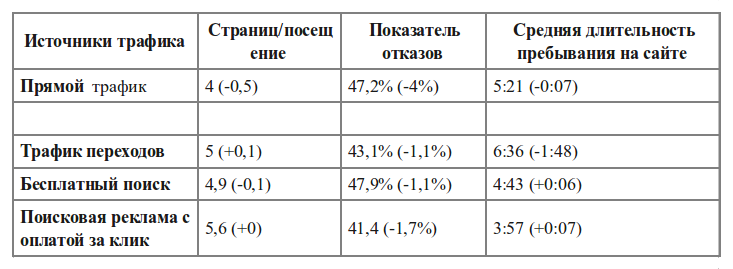
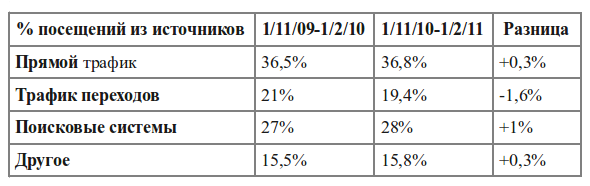
Details on traffic sources
The traffic sources below are defined by the source and medium (channel) parameters received by Google Analytics data servers. Parameter description is given in this article .
Conversion Rate Distribution
For many advertisers and owners of sites with a commercial component (online shopping), the most important indicator, of course, is the conversion rate. Below is the distribution of Google Analytics conversion rate by country.
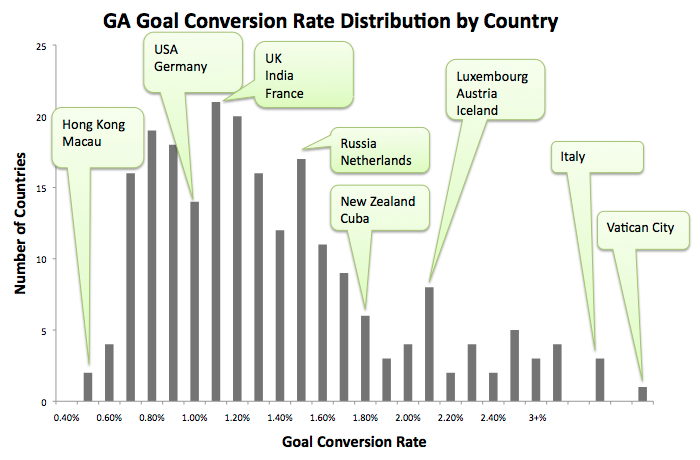
In countries where there is a lot of conversions, the conversion rate is also high, that is, it indicates a small number of visits, while the traffic remains fairly good. It should be noted that for countries with a small population, the value of the indicator may be statistically unreliable.
Traffic sources
The traffic sources below are defined by the source and medium (channel) parameters received by Google Analytics data servers. Parameter description is given in this article .
Operating Systems
Browsers and operating systems are identified by the referrer line (referral URL) sent by user browsers.

Unfortunately, in Russia there is still very little attention paid to the quality of the site and its content, only a few carry out at least some work on web analysis. Many people are engaged in attracting traffic, often of poor quality, instead of retaining traffic and converting it into customers. As a result, sites have high bounce rates, low conversion rates, and, accordingly, low company revenue levels.
We hope that after the publication and reading of these data, you will be more attentive to your online resource, because it is often he who is looking at, initially getting to know the company.
Most likely, this form of material presentation will allow the user to maximize the use of anonymous Google Analytics statistics.
The report provides a summary of all websites whose owners have enabled the sharing of anonymous data in Google Analytics. This newsletter is intended only for those website administrators who have enabled the mode of providing anonymous data . It should be noted that anonymous data provide hundreds of thousands of sites, therefore information can be considered objective and statistically representative for the purposes of web analysis.
The first message of the newsletter says that the statistics is presented for the period from November 1, 2010 to February 1, 2011, the comparison is made with the same period of 2009-2010. The report contains only relative indicators of comparison, absolute indicators, such as the total number of visits, page views and conversions for all websites, unfortunately, are not given.
Site Usage Indicators
Comparing the number of pages viewed per visit in the presented periods, you can see that the average length of time on the site and the bounce rate have decreased.
')
Country Details
Naturally, the structure of the anonymous Google database has the ability to breakdown data by country, which is also an important characteristic for Google Analytics users. Below are summary indicators for some countries. The first value in each cell is the indicator for the period from November 1, 2010 to February 1, 2011. The change in year to year is indicated in brackets (compared to the previous year).
The distribution of the failure rate by country is as follows:
In Russia, while the bounce rate is rather high, this is due to the fact that so far not all are using the web analytics capabilities in practice, which allow to reduce the number of failures on the site.
The diagram shows some countries that are vivid examples of individual groups by level of economic development.
Another important indicator that is associated with the already considered - is the duration of your stay on the site. The chart is below.
On the graph of the duration of stay on the site separately mentioned countries are arranged in reverse order when compared with the diagram of the failure rate.
Details on traffic sources
The traffic sources below are defined by the source and medium (channel) parameters received by Google Analytics data servers. Parameter description is given in this article .
Conversion Rate Distribution
For many advertisers and owners of sites with a commercial component (online shopping), the most important indicator, of course, is the conversion rate. Below is the distribution of Google Analytics conversion rate by country.
In countries where there is a lot of conversions, the conversion rate is also high, that is, it indicates a small number of visits, while the traffic remains fairly good. It should be noted that for countries with a small population, the value of the indicator may be statistically unreliable.
Traffic sources
The traffic sources below are defined by the source and medium (channel) parameters received by Google Analytics data servers. Parameter description is given in this article .
Operating Systems
Browsers and operating systems are identified by the referrer line (referral URL) sent by user browsers.
Unfortunately, in Russia there is still very little attention paid to the quality of the site and its content, only a few carry out at least some work on web analysis. Many people are engaged in attracting traffic, often of poor quality, instead of retaining traffic and converting it into customers. As a result, sites have high bounce rates, low conversion rates, and, accordingly, low company revenue levels.
We hope that after the publication and reading of these data, you will be more attentive to your online resource, because it is often he who is looking at, initially getting to know the company.
Source: https://habr.com/ru/post/124034/
All Articles