Measurement of structural deformation by photogrammetry
At present, mechanical measurement methods, due to their imperfection (be it high error or laboriousness of measurements), fade into the background, giving way to new methods, among which there is one - photogrammetry, which I would like to talk about.
Photogrammetry is a technology for determining the shapes, sizes and positions of objects from their photographic images.
Photogrammetry has received the most widespread use in geodesy, cartography, military science, space research, etc. But we will talk about a narrower application of technology, namely, in the study of materials.
One of the experiments conducted in the study of material properties is to measure the deformation under the action of various loads.
In the classic version, the experiment is carried out manually: for different loads, the value of strain is determined using mechanisms called mesramy. Tedious process, and even the accuracy of the materials in most cases is limited to 0.01mm. Photogrammetry, in this case, allows you to simplify the process of determining the strain, to increase the measurement accuracy, to automate data processing.
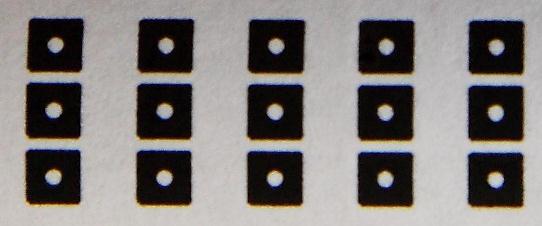
As reference points in the photographs, three dimensions (1, 2, 4 cm) of the following type were used:
The workspace looks like it was shot from three focal lengths (for testing purposes) and looks like this:
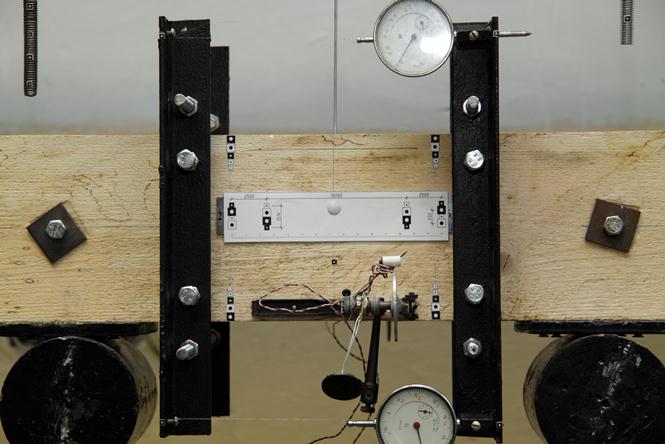
No pictures can be seen scale bar (center), stable points (left and right corners).
')
Required accuracy: 0.01mm or higher.
Optional: automatic tag detection, automatic tag offset tracking.
When implementing the conceived ideas, pitfalls appeared, due to which some software requirements had to be reformulated.
A classic case of recognition, but it was here that the first pitfall was met. Were tried several approaches to the selection of labels, but none gave an acceptable result:
Neural networks. Training was carried out on all sorts of options tags (one size). For processing by the neural network, the original image was cut into fragments of 32x32 pixels, and fed to the input of the network. The result of this algorithm was unsatisfactory: about 20% of the recognized tags.
Filter with a given mask . The input of the algorithm is the image of the original label in shades of gray, which is converted into a mask. If the size of the label is too large, only the central part of the label becomes the mask. As a result, the array is filled 48x48. The next step is to apply the mask to the image. As a result - the centers of the tags have a brightness of almost 100%, the rest of the image is darkened. The percentage of recognition - 60-70%. Not bad, but the minuses cross out the pluses: processing of one photo in the order of 2-4 minutes, user participation is required (indicating the initial mark).
After analyzing the analogues and evaluating the result of their recognition, it was decided to abandon the automatic detection of tags and focus on other problems.
Distortion is an aberration of optical systems, in which the linear increase varies in the field of view. In this case, the similarity between the object and its image is violated.
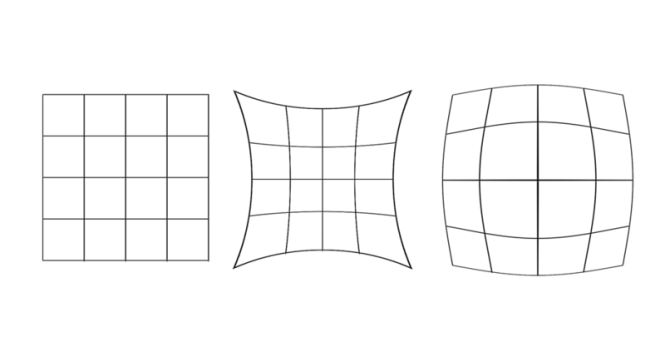
When shooting at close range - does not affect the measurement result. To correct the distortion, the OpenCV library was used.
The program loads images of each material loading. The greater the load on the material - the greater the deformation. Accordingly, the labels are shifted. The algorithm used to track tags is simple: on each next photo we look for a label in a specific area currentCoordinates + C , where C is a given constant relative to the center of the label in the current photo.
This function saves the user from monotonous manual labeling on each photo.
The core of the program. After determining the approximate location of the label, it is necessary to calculate the exact coordinate in tenths or even hundredths of a pixel.
The algorithm for determining the center consists of several steps:
1. Definition of the preliminary center of the label. The pre-center is obtained as a result of manually specifying the center or as a result of the function of automatic tracking of tag offset.
2. The selection of the area around the label for analysis. Required label sizing by user.
3. Application of adaptive binarization algorithm. In photographs with the naked eye visible differences in brightness. Sauvol's algorithm is used.
Each white pixel obtained as a result of binarization is included in the calculations. The calculation is carried out according to the center of mass formula:
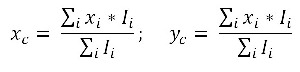
Where I is the brightness of the i-th pixel, Xi is the coordinate.
Algorithm result (anti-aliasing is applied to the image):

To determine the scale, a fixed scale bar is used with two marks attached at a given distance. Knowing the distance in centimeters between the centers of two points, it is easy to calculate the value of px / cm.
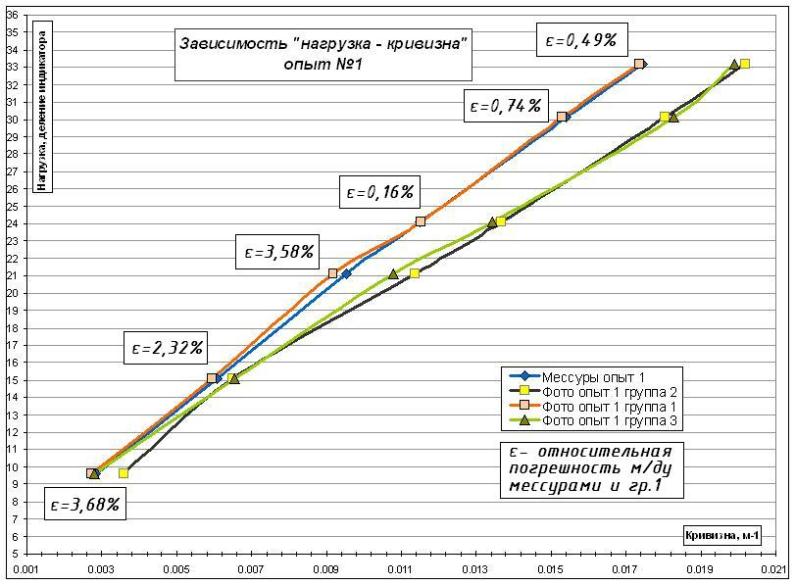
And now about the most important thing - about the results. And they turned out to be encouraging: the accuracy of the masses is practically achieved, deviations from measurements by third-party programs - 3–5%.
It was experimentally possible to establish that the highest accuracy in determining the center of a pixel is achieved with a label size of 2 cm.
Encouraging results:
Although there are such results:

The program was created for educational purposes and in the future can be used to obtain a bachelor's degree. Also, the development of the program is not stopped, it continues to be improved and work in the field of stereometry is planned in the future.
1. Gary Bradski, Adrian Kaehler - Learning OpenCV
2. William K. Pratt - Digital Image Processing
Introduction
Photogrammetry is a technology for determining the shapes, sizes and positions of objects from their photographic images.
Photogrammetry has received the most widespread use in geodesy, cartography, military science, space research, etc. But we will talk about a narrower application of technology, namely, in the study of materials.
One of the experiments conducted in the study of material properties is to measure the deformation under the action of various loads.
In the classic version, the experiment is carried out manually: for different loads, the value of strain is determined using mechanisms called mesramy. Tedious process, and even the accuracy of the materials in most cases is limited to 0.01mm. Photogrammetry, in this case, allows you to simplify the process of determining the strain, to increase the measurement accuracy, to automate data processing.
Highlights
As reference points in the photographs, three dimensions (1, 2, 4 cm) of the following type were used:
The workspace looks like it was shot from three focal lengths (for testing purposes) and looks like this:
No pictures can be seen scale bar (center), stable points (left and right corners).
')
Required accuracy: 0.01mm or higher.
Optional: automatic tag detection, automatic tag offset tracking.
Technical implementation
When implementing the conceived ideas, pitfalls appeared, due to which some software requirements had to be reformulated.
Automatic tag detection
A classic case of recognition, but it was here that the first pitfall was met. Were tried several approaches to the selection of labels, but none gave an acceptable result:
Neural networks. Training was carried out on all sorts of options tags (one size). For processing by the neural network, the original image was cut into fragments of 32x32 pixels, and fed to the input of the network. The result of this algorithm was unsatisfactory: about 20% of the recognized tags.
Filter with a given mask . The input of the algorithm is the image of the original label in shades of gray, which is converted into a mask. If the size of the label is too large, only the central part of the label becomes the mask. As a result, the array is filled 48x48. The next step is to apply the mask to the image. As a result - the centers of the tags have a brightness of almost 100%, the rest of the image is darkened. The percentage of recognition - 60-70%. Not bad, but the minuses cross out the pluses: processing of one photo in the order of 2-4 minutes, user participation is required (indicating the initial mark).
After analyzing the analogues and evaluating the result of their recognition, it was decided to abandon the automatic detection of tags and focus on other problems.
Distortion
Distortion is an aberration of optical systems, in which the linear increase varies in the field of view. In this case, the similarity between the object and its image is violated.
When shooting at close range - does not affect the measurement result. To correct the distortion, the OpenCV library was used.
Automatic tracking of tag offset
The program loads images of each material loading. The greater the load on the material - the greater the deformation. Accordingly, the labels are shifted. The algorithm used to track tags is simple: on each next photo we look for a label in a specific area currentCoordinates + C , where C is a given constant relative to the center of the label in the current photo.
This function saves the user from monotonous manual labeling on each photo.
Mark Center Definition
The core of the program. After determining the approximate location of the label, it is necessary to calculate the exact coordinate in tenths or even hundredths of a pixel.
The algorithm for determining the center consists of several steps:
1. Definition of the preliminary center of the label. The pre-center is obtained as a result of manually specifying the center or as a result of the function of automatic tracking of tag offset.
2. The selection of the area around the label for analysis. Required label sizing by user.
3. Application of adaptive binarization algorithm. In photographs with the naked eye visible differences in brightness. Sauvol's algorithm is used.
Each white pixel obtained as a result of binarization is included in the calculations. The calculation is carried out according to the center of mass formula:
Where I is the brightness of the i-th pixel, Xi is the coordinate.
Algorithm result (anti-aliasing is applied to the image):
Scale
To determine the scale, a fixed scale bar is used with two marks attached at a given distance. Knowing the distance in centimeters between the centers of two points, it is easy to calculate the value of px / cm.
results
And now about the most important thing - about the results. And they turned out to be encouraging: the accuracy of the masses is practically achieved, deviations from measurements by third-party programs - 3–5%.
It was experimentally possible to establish that the highest accuracy in determining the center of a pixel is achieved with a label size of 2 cm.
Encouraging results:
Although there are such results:
Conclusion
The program was created for educational purposes and in the future can be used to obtain a bachelor's degree. Also, the development of the program is not stopped, it continues to be improved and work in the field of stereometry is planned in the future.
Bibliography
1. Gary Bradski, Adrian Kaehler - Learning OpenCV
2. William K. Pratt - Digital Image Processing
Source: https://habr.com/ru/post/123935/
All Articles