Million Concurrent Connections on Node.js
TL; DR:
- Node.js v0.8 allows you to handle 1 million simultaneous HTTP Comet connections to the Intel Core i7 Quad / 16 Gb RAM with almost no additional settings.
- A little more than 10 Kb of memory is spent per connection (4.1 Kb Javascript Heap + 2.2 Kb Node.js Native + 3.8 Kb Kernel) ..
- V8 Garbage Collector is not designed to manage> ~ 500Mb of memory. If you exceed, you need to switch to an alternative garbage collection mode, otherwise the server “responsiveness” will be greatly reduced.
- Such an experience can (and should be!) Cost-effectively repeat itself (see under the cut).
Introduction
In foreign blogs, several tests of the maximum number of simultaneous connections were considered, from the classic A Million User Comet Applicaction with Mochiweb / Erlang , to the very recent Node.js w / 250k concurrent connections . What I would like to achieve in my test is recurrence. So that others can repeat without any problems and get their test results. All the code that was used in the tests is laid out on github: server and client , welcome.
Server
1. Iron
Of course, you need a Dedicated Server to conduct such tests. Order it from your favorite host or use an existing one. I used Hetzner EX4 (Core i7-2600 Quad, 16Gb RAM), it is quite cheap and powerful.
')
2. Operating system
I am using Ubuntu 12.04 LTS. Perhaps my test can be used in other Linux-s, with minor changes. Most likely this is not a ride on other OS. There is a lot of talk on the network about setting up Linux for a large number of connections. What pleases, almost none of this is needed:
#/etc/security/limits.conf # ( ). * - nofile 1048576 #/etc/sysctl.conf # netfilter/iptables, : net.ipv4.netfilter.ip_conntrack_max = 1048576 3. Code for Node.js
All tests use Node.js v0.8.3.
We use the standard cluster module to distribute the load on several processes (by the number of cores). Disable the Nagle algorithm .
// Server.js () var cluster = require('cluster'); var config = { numWorkers: require('os').cpus().length, }; cluster.setupMaster({ exec: "worker.js" }); // Fork workers as needed. for (var i = 0; i < config.numWorkers; i++) cluster.fork() // Worker.js () var server = require('http').createServer(); var config = {...}; server.on('connection', function(socket) { socket.setNoDelay(); // . }); var connections = 0; server.on('request', function(req, res) { connections++; // '' 20 // = 50 1 var pingInterval = setInterval(function() { res.write('ping'); }, 20*1000); res.writeHead(200); res.write("Welcome!"); res.on('close', function() { connections--; clearInterval(pingInterval); pingInterval = undefined; }); }); server.listen(config.port); For the convenience of monitoring what is happening, I added tracking and displaying of a variety of system parameters in the terminal, as well as their logging. You can run this miracle of interactivity on your server as follows:
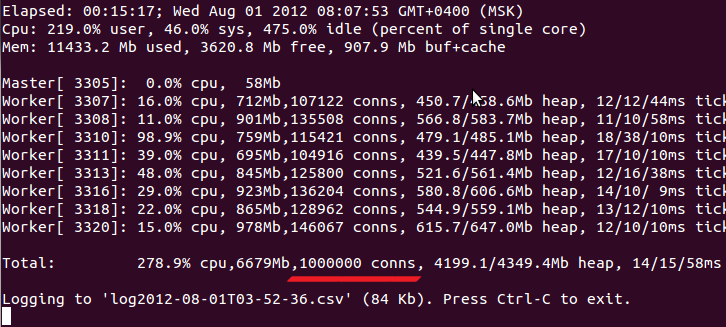
git clone git://github.com/ashtuchkin/node-millenium.git cd node-millenium # 8888. node server.js We get a picture similar to this:

Here it is necessary to note the following:
- The percentages of CPU utilization are everywhere given based on the number of cores. Those. on a 4-core processor, the maximum load is 400%.
- The 'used' memory does not include buf + cache. Those. should be used + free + (buf + cache) = total memory on the server.
- For each process, its pid, processor load share (user + sys), RSS memory, number of connections, heapUsed / heapTotal according to os.memoryUsage () readings, three dimensions of the process “responsiveness” (ticks, see below) are displayed.
What is this “responsiveness” of the process? Conventionally, this is how long it will take to wait for an event before the Event Loop Node.js will process it. This parameter is fundamental in applications that count on at least some real-time, but it is quite difficult to calculate.
We will measure it as follows:
// Node.js 10 . var ticks = []; setInterval(function() { ticks.push(Date.now()); }, 10); // . setInterval(function() { // 1. : ticks[i] = ticks[i+1]-ticks[i] // 2. ticks (tick-avg), 90- (tick-max). // 3. . ticks.length=0; }, 1000); I want to separately note that the measurement interval of 10 ms was chosen as the balance between the error and add. system load. If 10/10 / 10ms is displayed, this does not mean that Node.js spends 10 ms to process each event. This means that with a measurement grid of 10 ms, the Event Loop is free every time and is ready to process any incoming event at once, which means that the average event processing time is much lower. If the Garbage Collector comes into action, or long operations, then we will instantly see and fix it.
The log is in the CSV format, where once per second all aggregate statistics of the system are noted (see the list on the github ).
Customers
Oddly enough, it was more difficult to provide the necessary load than to create a server. The fact is that a TCP connection is uniquely identified by a four [source ip, source port, dest ip, dest port], so from one machine to one server port you can create no more than 64 thousand simultaneous connections (by the number of source ports). It would be possible to create 16 network interfaces with different IP, as described here , but it is difficult when the machine is hosted.
As a result, it was decided to use Amazon EC2 Micro Instances at 2 cents per hour. It was found out that such a machine, due to limitations on the processor and, especially, memory, stably holds about 25 thousand connections. Thus, 40 running instances will provide us with 1 million connections and will cost $ 0.8 per hour. It is quite acceptable.
Separately, it must be said that by default, Amazon will not allow you to raise more than ~ 20 instances in one region. You can either make a request to increase this limit, or raise instances in several regions. I chose the latter.
First, I set up one machine and copied it 40 times using the Custom AMI creation mechanism — this is easy to do via the web interface. However, it turned out to be too difficult to maintain and uncontrollable, so I switched to another mechanism: User Data and Cloud Init .
In short, it works like this: Ubuntu standard images are used (they are different in each region) and the script is specified as a parameter when the instance starts. It is executed on the instance immediately after it is raised. In this script, I install Node.js on a bare system, write the necessary files, and launch the node that listens to a specific port. Further, on this port you can find out the server status, as well as give it commands, for example, how many connections to establish with which ip address. The time from the team to the working "drone" is about 2 minutes.
What is nice - the client code can be edited before each instance is launched.
You can try it yourself using the ec2-fleet project and the following commands:
git clone git://github.com/ashtuchkin/ec2-fleet.git cd ec2-fleet # npm install # accessKeyId, accessKeySecret Amazon. # https://portal.aws.amazon.com/gp/aws/securityCredentials # , ( ) # ! Security Group 'default' # TCP 8889 source 0.0.0.0/0 - . nano aws-config.json # , , 10 . # . , . ./aws.js start 10 # ( top). . ./aws.js status # (, , ) ./aws.js set host <ip> # 1000 ./aws.js set n 1000 # - 25000 ./aws.js set n 25000 # . . ./aws.js set restart 1 # . - . ./aws.js stop all Tests
Well, let's start testing. Here and in the following tests we will make 1 million connections, 50 thousand messages per second at all. Node.js version v0.8.3. Processing will be carried out in 8 processes ("workers") by the number of server cores.
node server.js
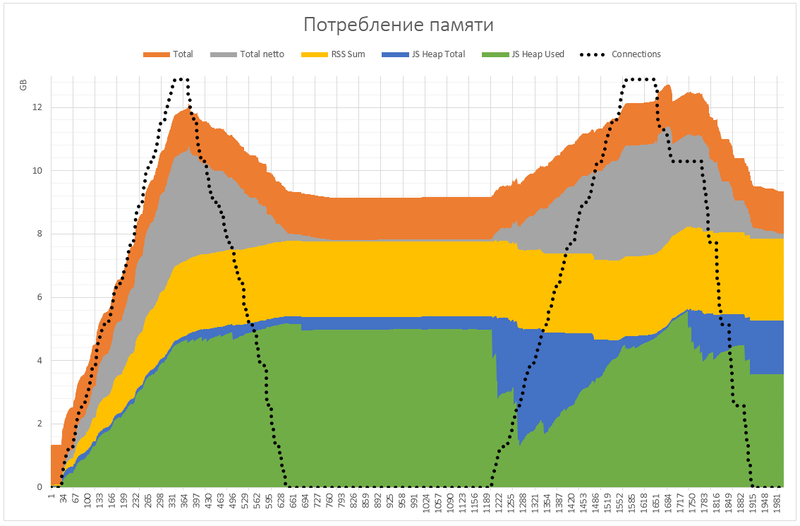
In the first test, we will run node.js without additional flags, in the standard configuration itself. Begin the first test (all pictures are clickable):
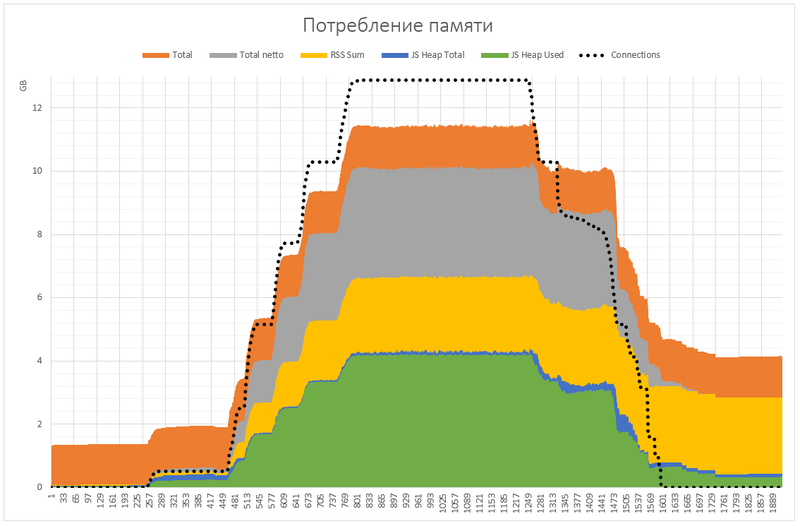
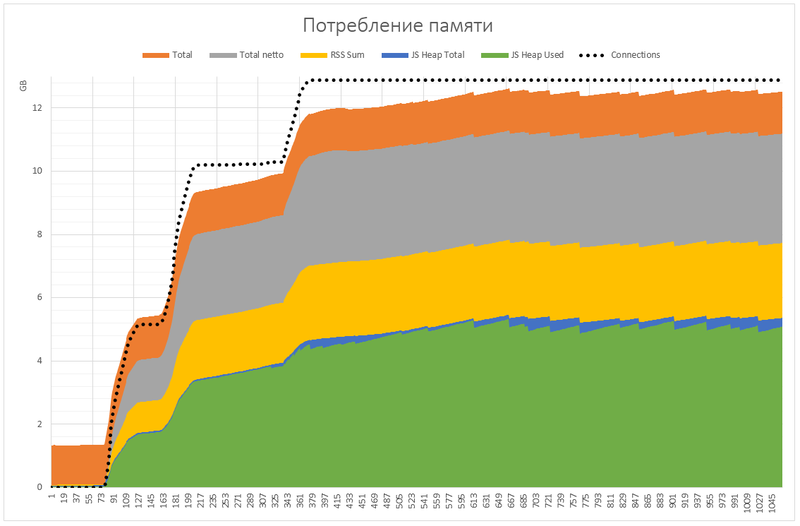
On all charts, the black dotted line indicates the number of connections, with a maximum value of 1 million. Horizontally, seconds from the beginning of the test, vertical lines mark the minutes. The memory graphs show: Total - the total number of used memory (recall, testing was conducted on a server with a total memory of 16 Gb), Total netto - an increase in Total compared to the first second (was entered because some more my projects, in total they occupy ~ 1.3 Gb), RSS mem, JS Heap Total, JS Heap Used - the total value of RSS (link), JS Heap Total, JS Heap Used of all processes node.js.
Visually, the size of the gray area indicates the amount of memory allocated by the kernel, the yellow area indicates the node.js native structures, and the green area indicates JS Heap.
As you can see, Total netto at the peak is 10 Gb and is stable. After the experiment, all the parameters are returned to almost the original values except for the node.js native structures. We return to them below.
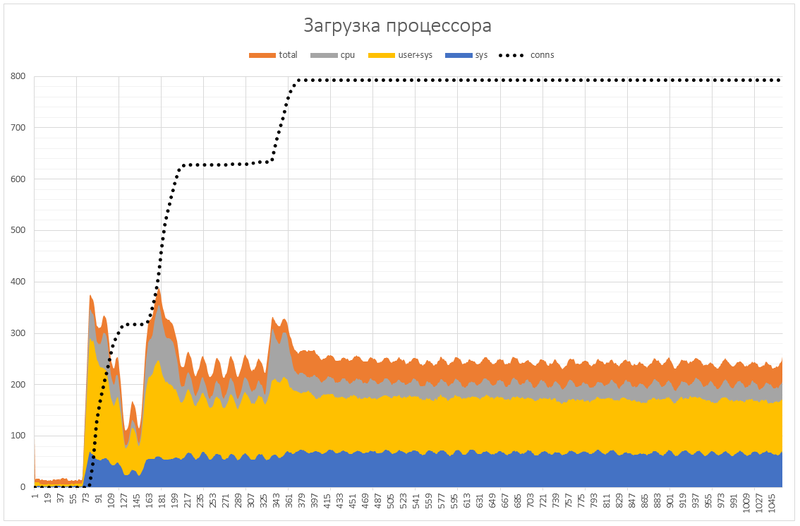
CPU load on the same test:
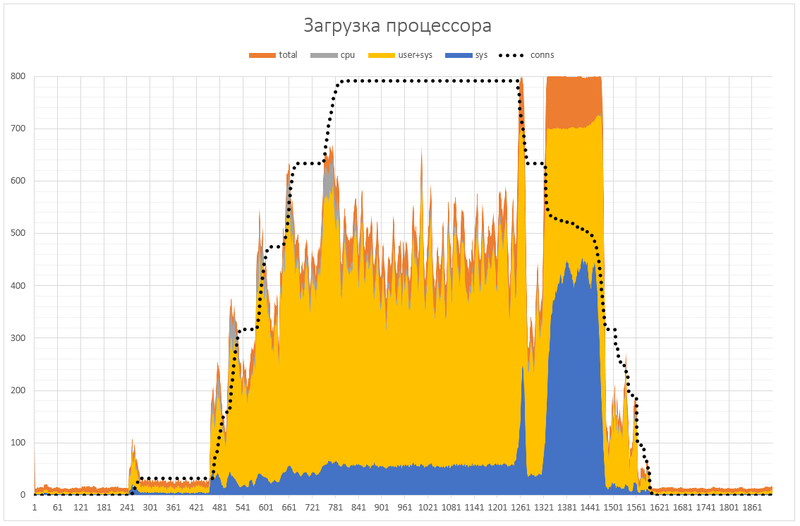
Everything is easier here - 8 cores = 800%. Total - total load, CPU (practically coincides with Total) - total load of processes node.js, User, Sys - total load in User mode and the core, respectively. The lines are smoothed by a moving average of 10 seconds.
This chart, to be honest, disappointed me. The download is too big, and it is not clear what it is spent on. Receiving connections was normal, about 5-7 thousand connections per second, apparently, this scenario is well optimized. However, a much greater load is created by detachment, especially in large batches (on the graph for about 3 minutes, 800% of the load when I tried to break 400 thousand connections at once).
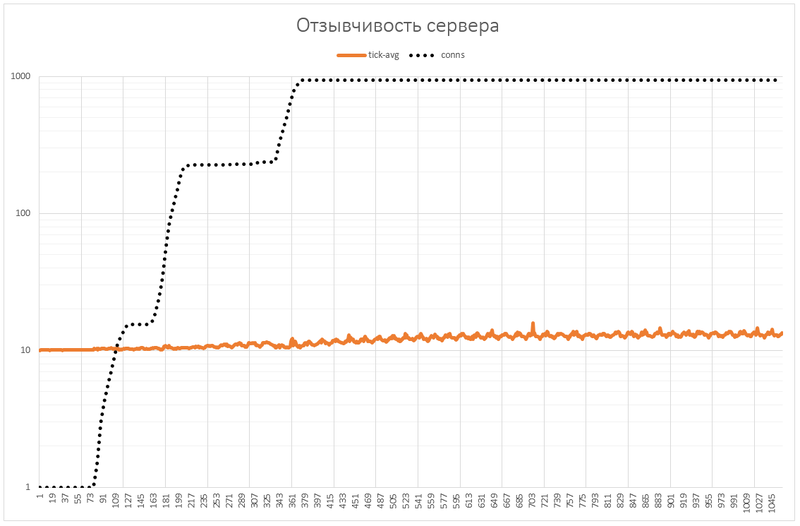
Let's see how the Event Loop behaves:
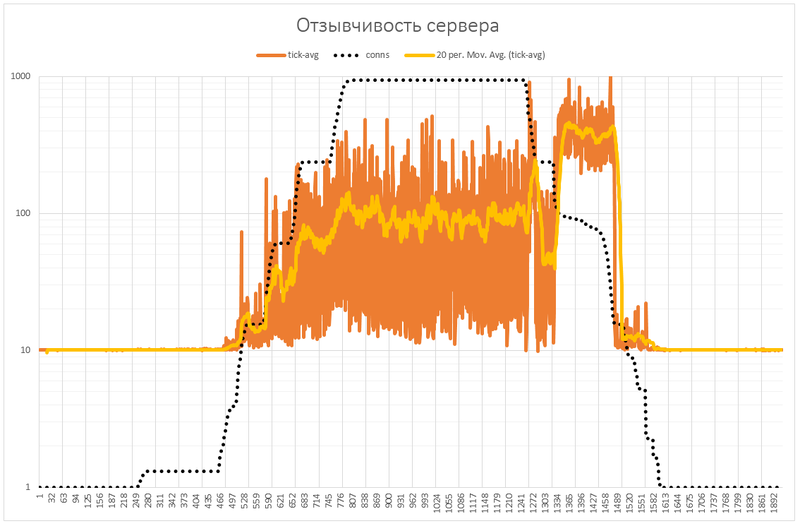
This graph shows the average values of tick-avg for 8 workers (unfortunately, the tick-max could not be restored because of the bug). Scale logarithmic to reflect large fluctuations. The yellow line shows the moving average for 20 seconds.
As you can see, on average, with 1 million connections to the Event Loop, it is possible to get access only 10 times per second (yellow line ~ 100 ms). It is simply no good. When 400 thousand connections are disconnected, the average event processing time increases to 400 ms.
After using Google for its intended purpose and conducting several experiments on a smaller scale, it was found out that the main part of the load is caused by the Garbage Collector, who often tries to collect extra memory using the “heavy” Mark & Sweep algorithm (there are two of them in the V8 - there is also “lightweight” Scavenge) . Responsibility for this behavior lies somewhere on the border between Node.js and V8, and is associated with the Idle Notification mechanism. In short, this is a signal to V8 that the work is not being done now and there is time to clean up the garbage that Node.js is abusing, especially if JS HeapTotal> 128Mb.
node --nouse-idle-notification server.js
Fortunately, we can turn off this signal by adding the "--nouse-idle-notification" flag. Let's see what it will give us in the second test:
First, it can be noted that the memory consumption increased by 1 GB (10%) and stabilized approximately 5 minutes after the last connection, which is generally not bad. Also, the "sawtooth" character of the chart is visible. Why?
Let's look at the graph of memory consumption of one worker in a simplified test:
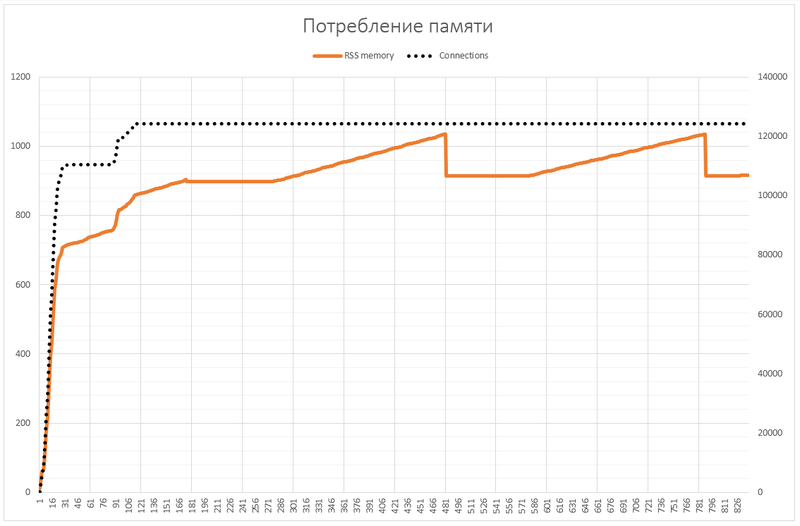
Now it is clear - about every 5 minutes garbage is collected in each worker, forming a “saw” in the graph of the total memory.
We look at the processor and Event Loop:
Well, so much better! 1 million connections load from 2 to 3 cores out of 8.
Now let's see if the Garbage Collector does well without IdleNotification in the third test:
From this graph, it can be seen firstly that the yellow area (Node.js native structures) still did not leak, but was being reused. Secondly, garbage collection could be better.
node --nouse-idle-notification --expose-gc server.js
Well, take the garbage collection in your hands. Run node.js with the "--expose-gc" flag and call gc (); once a minute in the fourth test:


Well, not bad. Memory is released quite quickly, the processor is under control, but once a minute we have bursts of tick-avg. I think this is a good compromise.
What's next?
First, it is necessary to confirm the results by independent testing. I did everything to make it easy. Please, if you have a good machine idle, try to make my own way - this is very interesting.
Secondly, it is clear that this benchmark is far from reality. As an interesting real-world application, it would be good to build an analogue of a jabber-server and test it on the same volumes.
In any case, I hope that the current framework will help the Node.js and V8 developers in further optimization.
Thirdly, you need to conduct more experiments to clarify:
- What does enable / disable the Nagle algorithm (socket.setNoDelay ())?
- One message in 20 seconds per connection is quite small. How many messages per second can the server handle? Perhaps this will be a limitation on real projects.
- You can more accurately determine the kernel's memory allocation for sockets using / proc / sockstat.
- Why is the yellow area not released (Node.js native)? What is it? How can this be fixed?
- Why closing sockets loads the processor much more than opening them?
- Try playing with the kernel settings for TCP, and also turn off the netfilter / conntrack / iptables module, maybe it will have a positive effect on the memory.
- Using the method with 40 AWS instances, try to load servers with other technologies - Erlang, Java NIO, Twisted, etc. Compare features.
- How fast is interprocess communication going? Is it possible to transmit an open descriptor between processes, grouping them into rooms, to localize the interaction between clients? This will greatly help in a real project.
Source: https://habr.com/ru/post/123154/
All Articles