Home bookkeeping using Google Docs
It just so happened that I was always interested in how much and what I spent on. For a long time I diligently went through various ways of accounting for personal finances. Used and offline tools, and online solutions, wore data on a flash drive and so on. I will not say that I tried everything from affordable, but, as it seems to me, I have gained a decent experience and made the appropriate conclusions.
First of all, everything that is written is not mine - it is written to others. It is obvious. But the consequence of this is that the other developed the logic, based on his own ideas about convenience and functionality. It means there is no certainty that other people's ideas will coincide 100% with mine. On Habré, this topic has already sounded.
The second important point - if the system will be used by two (not to mention more), the probability of errors increases many times. Many systems imply the presence of an account that displays the amount of money in the wallet. Oh, how I liked the GnuCash program ... But every month I had to add transactions to adjust the account for my wife’s wallet. And what she was spending money on was only to guess because she herself could not remember, and the checks were safely lost.
')
Based on the above problems, I spawned another home bookkeeping on Google Docs. Through trial and error, analyzing other people's decisions and proceeding from my own needs, I came to the following conclusions.
The system should be as simple as possible. It is so simple that when explaining how to use it, they would not say to me - “do not hold me for a fool”.
The emphasis of the system is how much and what is spent. I don’t care how much money I have on the map, in my wallet or at home under my pillow (although it was very convenient to know). It is important - how much is spent in the store, on loans and so on.
The following is a must control of obligatory payments. Rent, loan, internet - you need to pay every month. Plus, sometimes there are other payments that need to be made, but next month they will not, for example, order food for a dog.
And finally - the payment structure should be as simple as possible. For myself, I determined that the payment has three parameters. The first is the direction (income or expense). The second is a category. Shop, credit, bills, entertainment and so on. Total got about eight points. And the third is a subcategory. Or better to say - a comment. For example, a payment in the amount of 3,000 rubles can have the following parameters: Expense, Shop, Auchan. That is the third point, in an arbitrary, but as short as possible form, describing where they were spent or from where the money was received.
Now from theory to practice.
In Google documents I have created a collection - Budget. It includes tables where I enter the data. Each table file has a name - the month for which data is maintained. To determine the year to which a given month belongs - a collection is attached to the file, with a year. It looks like this:

Each file contains three tabs. Founded - Fact. This is the story of all the expenses and receipts in the specified month. For example, like this:
Every month I create a new file. And first and foremost I add entries with the direction "Own funds". I did not indicate the presence of such a direction above because it is used only once at the beginning of the month. So I note how much money is available at the beginning of the month.
Immediately, for mandatory spending this month, I add lines with a note that the data is not confirmed (for them, column F contains the value No). For example, if you need to pay for the Internet before the 10th of June, then I add a line with the date of June 10th, the amount is 500 rubles, the direction is the expense, the category is bills, the comment is Internet and confirmed is not.
After that, everything is as usual - I’m spending or receiving money in a table, and if an operation that was already planned (paid for the Internet, for example) was performed, then I correct the necessary line (I change the date and amount, if necessary, and change it to Yes)
But the simple accumulation of data is not particularly interesting. As noted above, it is important for me to know what and how much is spent. I used to try to make such analytics using unique values from the Category column, but more recently, Google has offered a tool for forming a pivot table. Thanks to him, my accounting system received a second wind (as the analyst's own crutch significantly complicated the use).
The pivot table is on a separate sheet - Pivot table. It is created very simply:
But the table just created needs some work.
First, through Edit range, I specify a data range - all columns are from A to F.
The second - for the series I specify the grouping in two fields - Date and Comment. This way I get a visual idea of how much and what is spent on a particular day. Grouping by date indicates the need to show the total amount. This allows you to see the bottom of the table totals.
The third is the column grouping. Here I group by Direction and Category. The direction note Show totals. This mark, in fact, is not necessary, but with it you need to perform one less action if you need to see the cost-income ratio. Otherwise, you would have to allocate the last row of the table and watch the amount.
Next - in the Value field I specify the Amount and operation - SUM.
And the last - filters. There are two filters. First by Category - all categories except Own funds. In principle, you can do it in the Direction - take into account only the directions of Income and Expenditure. The second filter is Confirmed. Only records that really took place are of interest. If a record is only scheduled, then it should not be in the pivot table.
In the end, my pivot table takes the following form:
But now I refuse the last filter - the one that is in the column Confirmed. Instead, the value of this column is used as the very first group in the Columns section. Due to this, the pivot table is divided into two parts. The first with the spending and income, the second - with the planned. The table is twice as wide and for this it is better to use the freezing of the first three rows and the first two columns. Then, when you scroll the table, the date, subcategory, and category will always be visible.
In this case, the table looks like this:

The most interesting thing in the pivot table is the bottom line. Due to groupings and calculation of the amounts, two areas are distinguished in it - the amount of income and the amount of expenses. And immediately displayed the amount by category.
After another rethinking of the budget structure, I decided to add a third sheet - the Plan. I had to work on this sheet and most likely the current version will not be changed once. Data on this sheet comes from two sources. The first is the Catogory column from the sheet Fact, the second is the manual input of numbers.
It would be very inconvenient each month to hammer in all categories. You can miss something or make a spelling mistake. Therefore, the data in the first column is filled automatically due to the following formula in cell A2:
The UNIQUE function takes only unique values from the list returned by the FILTER function. The FILTER function returns only those values from column D of the sheet Fact (Category) whose Direction (column C) is Consumption. That is, at the moment I plan only expenses, and at once across the entire Category. Planning 7 000 rubles for housing and communal services and 500 r. it seems to me excessive to pay for electricity - it is easier to immediately plan 7,500 rubles to pay bills.
After Google Docs has created a list of scheduled categories, you need to calculate the actual consumption for them. This is also made by the formula:
The familiar FILTER function searches in the Amount column only those values whose direction is Expense, and the Category is equal to that indicated on the sheet Plan. Passing the result of this function to SUM gives the actual amount by category. Filtering in the direction is very important because, for example, I have the “Accumulation” category both for the “Expenditure” direction and for “Own funds”.
Next in the Plan column I contribute the amount pledged by category for the month. And the number should be negative.
Delta columns are calculated using very simple formulas, but need some explanation.
Column D:
If the value in it is negative, then it shows how much more can be spent on this category. A positive number indicates a category overrun. Roughly speaking, a positive number says that you need to get so much money to eliminate the budget deficit.
Column E is the percentage of the plan. This column is, in fact, uninformative and just for those who love interest. I use the following formula:
-100% say that the plan is completely failed. That is, nothing was planned for the Category, but there was spending.
I get something like this:

That's all for now. If there is a desire to use just such an approach, then the sheet is in the Google Docs templates - the template to use .
Plus my approach - it is very simple (I think). All you need is to indicate at the beginning of the month how much money is in stock, and then just enter the expenses. And. Pointing your own funds, in fact, is the groundwork for the future. That is, by and large, it is possible and not to specify. I need it only to control what is being saved. In other words, it is important for me to know how much is already postponed for study, for example.
The table can be shared and give access to all family members. And since the money is spent or is not received in any account, they do not need to indicate that so much of the mum's wallet was spent. This simplifies the system, as well as relieves headaches when, according to the data, there should be a hundred rubles in the wallet, and in fact there are 50.
Guglotablitsy available, almost everywhere, and this is mobility. While on vacation, you can go to the documents and add the appropriate waste. Of course, this is roaming, in the worst case ... But as another measure, for the time of absence, enter the data directly into the phone (or write into a notebook), and then kill them in the table.
Another idea for further development is to connect a form to the table. This way you can get rid of extra traffic when adding data. True, there is a small complexity. When you enter data directly into a table, you can create a new category on the fly. When adding through a form, it is better to present the category as a drop-down list. True, this is also solved. For example, a list of categories and an input field. But then, apparently, you need another sheet, with the "raw" data, and then display them on the Fact sheet, adding the categories from the list and the new input fields.
If you go back to the very beginning of the article, then you see the biggest minus of the system - it solves specifically my tasks. I do not know and cannot know what requirements for accounting for finances you have. Perhaps you need a sheet with budget planning. Or more specific data processing is required. Therefore, perhaps, having looked at my delights, you will say - fu, how disgusting. But for me personally, the outlined approach is 100% suitable. It only has the functionality that I need, but does not limit the possibility of expansion.
Actually that's all. Thank.
First of all, everything that is written is not mine - it is written to others. It is obvious. But the consequence of this is that the other developed the logic, based on his own ideas about convenience and functionality. It means there is no certainty that other people's ideas will coincide 100% with mine. On Habré, this topic has already sounded.
The second important point - if the system will be used by two (not to mention more), the probability of errors increases many times. Many systems imply the presence of an account that displays the amount of money in the wallet. Oh, how I liked the GnuCash program ... But every month I had to add transactions to adjust the account for my wife’s wallet. And what she was spending money on was only to guess because she herself could not remember, and the checks were safely lost.
')
Based on the above problems, I spawned another home bookkeeping on Google Docs. Through trial and error, analyzing other people's decisions and proceeding from my own needs, I came to the following conclusions.
The system should be as simple as possible. It is so simple that when explaining how to use it, they would not say to me - “do not hold me for a fool”.
The emphasis of the system is how much and what is spent. I don’t care how much money I have on the map, in my wallet or at home under my pillow (although it was very convenient to know). It is important - how much is spent in the store, on loans and so on.
The following is a must control of obligatory payments. Rent, loan, internet - you need to pay every month. Plus, sometimes there are other payments that need to be made, but next month they will not, for example, order food for a dog.
And finally - the payment structure should be as simple as possible. For myself, I determined that the payment has three parameters. The first is the direction (income or expense). The second is a category. Shop, credit, bills, entertainment and so on. Total got about eight points. And the third is a subcategory. Or better to say - a comment. For example, a payment in the amount of 3,000 rubles can have the following parameters: Expense, Shop, Auchan. That is the third point, in an arbitrary, but as short as possible form, describing where they were spent or from where the money was received.
Now from theory to practice.
In Google documents I have created a collection - Budget. It includes tables where I enter the data. Each table file has a name - the month for which data is maintained. To determine the year to which a given month belongs - a collection is attached to the file, with a year. It looks like this:
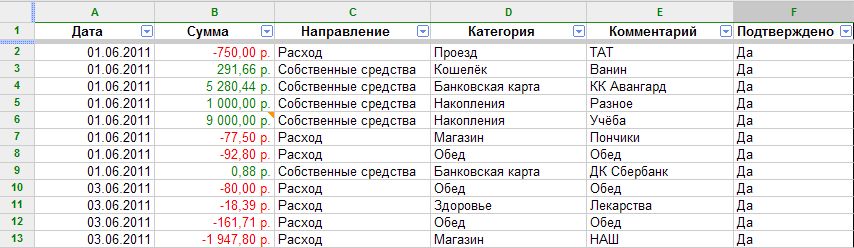
Each file contains three tabs. Founded - Fact. This is the story of all the expenses and receipts in the specified month. For example, like this:
Every month I create a new file. And first and foremost I add entries with the direction "Own funds". I did not indicate the presence of such a direction above because it is used only once at the beginning of the month. So I note how much money is available at the beginning of the month.
Immediately, for mandatory spending this month, I add lines with a note that the data is not confirmed (for them, column F contains the value No). For example, if you need to pay for the Internet before the 10th of June, then I add a line with the date of June 10th, the amount is 500 rubles, the direction is the expense, the category is bills, the comment is Internet and confirmed is not.
After that, everything is as usual - I’m spending or receiving money in a table, and if an operation that was already planned (paid for the Internet, for example) was performed, then I correct the necessary line (I change the date and amount, if necessary, and change it to Yes)
But the simple accumulation of data is not particularly interesting. As noted above, it is important for me to know what and how much is spent. I used to try to make such analytics using unique values from the Category column, but more recently, Google has offered a tool for forming a pivot table. Thanks to him, my accounting system received a second wind (as the analyst's own crutch significantly complicated the use).
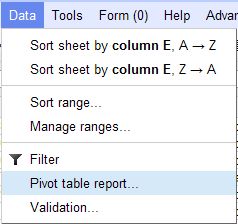
The pivot table is on a separate sheet - Pivot table. It is created very simply:
But the table just created needs some work.
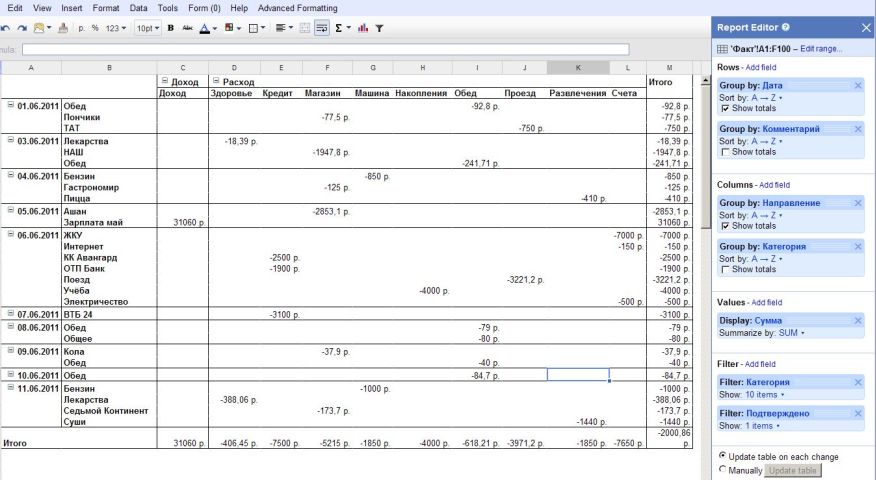
First, through Edit range, I specify a data range - all columns are from A to F.
The second - for the series I specify the grouping in two fields - Date and Comment. This way I get a visual idea of how much and what is spent on a particular day. Grouping by date indicates the need to show the total amount. This allows you to see the bottom of the table totals.
The third is the column grouping. Here I group by Direction and Category. The direction note Show totals. This mark, in fact, is not necessary, but with it you need to perform one less action if you need to see the cost-income ratio. Otherwise, you would have to allocate the last row of the table and watch the amount.
Next - in the Value field I specify the Amount and operation - SUM.
And the last - filters. There are two filters. First by Category - all categories except Own funds. In principle, you can do it in the Direction - take into account only the directions of Income and Expenditure. The second filter is Confirmed. Only records that really took place are of interest. If a record is only scheduled, then it should not be in the pivot table.
In the end, my pivot table takes the following form:
But now I refuse the last filter - the one that is in the column Confirmed. Instead, the value of this column is used as the very first group in the Columns section. Due to this, the pivot table is divided into two parts. The first with the spending and income, the second - with the planned. The table is twice as wide and for this it is better to use the freezing of the first three rows and the first two columns. Then, when you scroll the table, the date, subcategory, and category will always be visible.
In this case, the table looks like this:
The most interesting thing in the pivot table is the bottom line. Due to groupings and calculation of the amounts, two areas are distinguished in it - the amount of income and the amount of expenses. And immediately displayed the amount by category.
After another rethinking of the budget structure, I decided to add a third sheet - the Plan. I had to work on this sheet and most likely the current version will not be changed once. Data on this sheet comes from two sources. The first is the Catogory column from the sheet Fact, the second is the manual input of numbers.
It would be very inconvenient each month to hammer in all categories. You can miss something or make a spelling mistake. Therefore, the data in the first column is filled automatically due to the following formula in cell A2:
=UNIQUE(FILTER(''!D:D;''!C:C=""))The UNIQUE function takes only unique values from the list returned by the FILTER function. The FILTER function returns only those values from column D of the sheet Fact (Category) whose Direction (column C) is Consumption. That is, at the moment I plan only expenses, and at once across the entire Category. Planning 7 000 rubles for housing and communal services and 500 r. it seems to me excessive to pay for electricity - it is easier to immediately plan 7,500 rubles to pay bills.
After Google Docs has created a list of scheduled categories, you need to calculate the actual consumption for them. This is also made by the formula:
=SUM(FILTER(''!B:B;''!C:C="";''!D:D=A2))The familiar FILTER function searches in the Amount column only those values whose direction is Expense, and the Category is equal to that indicated on the sheet Plan. Passing the result of this function to SUM gives the actual amount by category. Filtering in the direction is very important because, for example, I have the “Accumulation” category both for the “Expenditure” direction and for “Own funds”.
Next in the Plan column I contribute the amount pledged by category for the month. And the number should be negative.
Delta columns are calculated using very simple formulas, but need some explanation.
Column D:
=B2-C2If the value in it is negative, then it shows how much more can be spent on this category. A positive number indicates a category overrun. Roughly speaking, a positive number says that you need to get so much money to eliminate the budget deficit.
Column E is the percentage of the plan. This column is, in fact, uninformative and just for those who love interest. I use the following formula:
=(B2/C2)-1-100% say that the plan is completely failed. That is, nothing was planned for the Category, but there was spending.
I get something like this:
That's all for now. If there is a desire to use just such an approach, then the sheet is in the Google Docs templates - the template to use .
Plus my approach - it is very simple (I think). All you need is to indicate at the beginning of the month how much money is in stock, and then just enter the expenses. And. Pointing your own funds, in fact, is the groundwork for the future. That is, by and large, it is possible and not to specify. I need it only to control what is being saved. In other words, it is important for me to know how much is already postponed for study, for example.
The table can be shared and give access to all family members. And since the money is spent or is not received in any account, they do not need to indicate that so much of the mum's wallet was spent. This simplifies the system, as well as relieves headaches when, according to the data, there should be a hundred rubles in the wallet, and in fact there are 50.
Guglotablitsy available, almost everywhere, and this is mobility. While on vacation, you can go to the documents and add the appropriate waste. Of course, this is roaming, in the worst case ... But as another measure, for the time of absence, enter the data directly into the phone (or write into a notebook), and then kill them in the table.
Another idea for further development is to connect a form to the table. This way you can get rid of extra traffic when adding data. True, there is a small complexity. When you enter data directly into a table, you can create a new category on the fly. When adding through a form, it is better to present the category as a drop-down list. True, this is also solved. For example, a list of categories and an input field. But then, apparently, you need another sheet, with the "raw" data, and then display them on the Fact sheet, adding the categories from the list and the new input fields.
If you go back to the very beginning of the article, then you see the biggest minus of the system - it solves specifically my tasks. I do not know and cannot know what requirements for accounting for finances you have. Perhaps you need a sheet with budget planning. Or more specific data processing is required. Therefore, perhaps, having looked at my delights, you will say - fu, how disgusting. But for me personally, the outlined approach is 100% suitable. It only has the functionality that I need, but does not limit the possibility of expansion.
Actually that's all. Thank.
Source: https://habr.com/ru/post/122842/
All Articles