Using TileMill

In the last post I talked about the cartographic design studio TileMill . He scored some positive reviews, and I decided to continue.
In this post will be considered:
- Data preparation, reprojection in Web Mercator
- Improving the speed of processing shape files
- Creating a project and importing data into the studio
- Creation of a point layer of earthquakes
- Standard selectors and attribute table
Interesting? I invite under the cat.
')
Data preparation, reprojection in Web Mercator
As I said before, maps in TileMill are always projected into Web Mercator. This projection is used by Microsoft Bing Maps, Google Maps and ESRI ArcGIS Online. In order to simplify further work, we reproject our spatial data. This will increase the speed of displaying data in Mapnik. In addition, it is a good practice to verify the correctness of the source data.
To do this, I will use the utility OGR , which is part of the GDAL library.
ogr2ogr reprojected.shp source.shp -t_srs EPSG:900913Where source.shp is the source file. This command will create a new reprojected.shp file reprojected in Web Mercator (its EPSG code is 900913).
Important. If you reproject a layer from WGS84, you may encounter incorrect display of polygons on certain parallels. Usually, it is enough to use the trim function in OGR.
ogr2ogr fixed.shp source.shp -t_srs EPSG:900913 -clipsrc -180 -90 180 90Note : OGR version must be at least 1.7. A detailed solution to this problem can be found here .
Improving the speed of processing shape files
When the shape layer of a file contains many objects, its processing speed may take a long time. As you remember, TileMill works on the basis of the Mapnik library. This library includes a utility for indexing shape files - shapeindex . Indexing can significantly increase the speed of processing spatial data. This utility creates an index file based on your spatial data. The Mapnik index file format uses the .index extension. The index file describes the elements included in the shape file, allowing the handler to quickly find out where the data necessary for visualization is located, instead of performing a slow search over the entire file.
Using shapeindex is very simple:
shapeindex shapefile.shpThis utility will create a new index file called shapefile.index, which needs to be stored along with the rest of the shape collection's data (* .shp, * .shx, * .dbf, etc.).
When testing, it is noticeable that the processing of a layer containing about 100,000 points and 12 levels of representation takes about 24 hours. While processing the same layer containing the index file takes about an hour.
Now that everything is ready, let's load the data into the studio. All we need is to pack our collection of shape files into a zip archive and upload it to the files / data directory, inside TileMill.
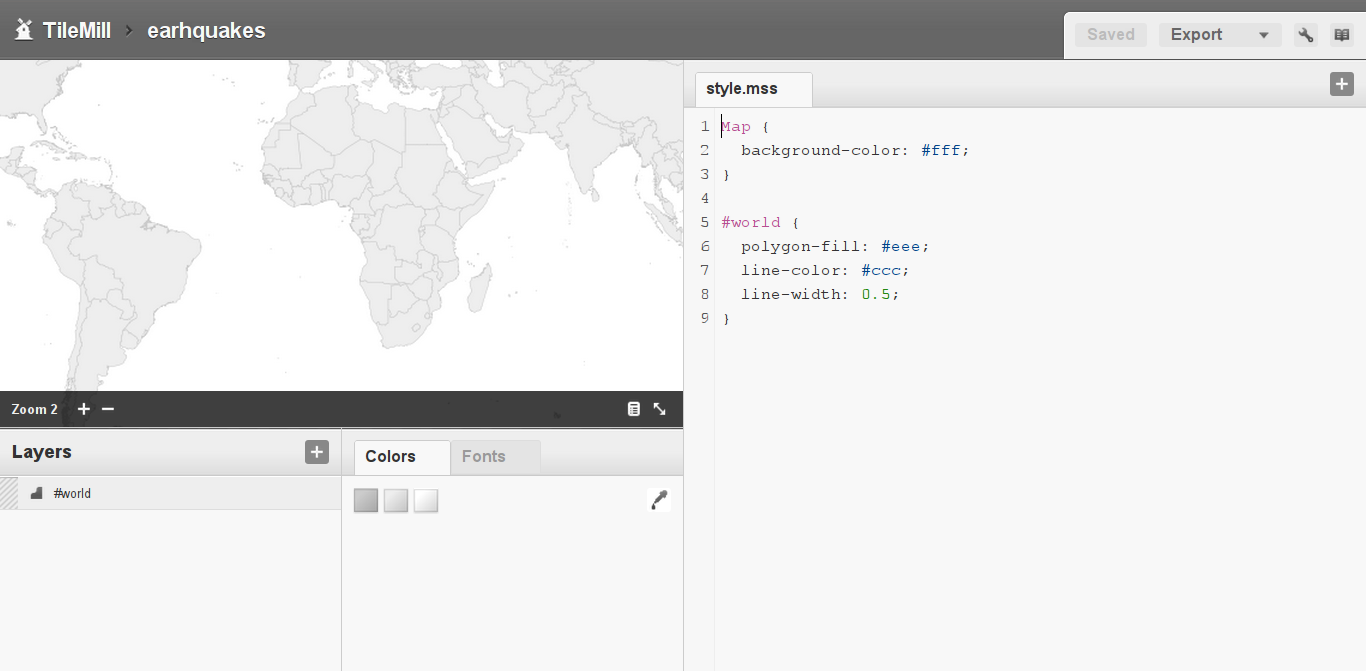
Creating a project and importing data into the studio
So, the data are prepared, we will start the creation of the first project. The project name can contain only Latin letters, numbers, dashes and underscores.

New earthquakes project created. New project window.
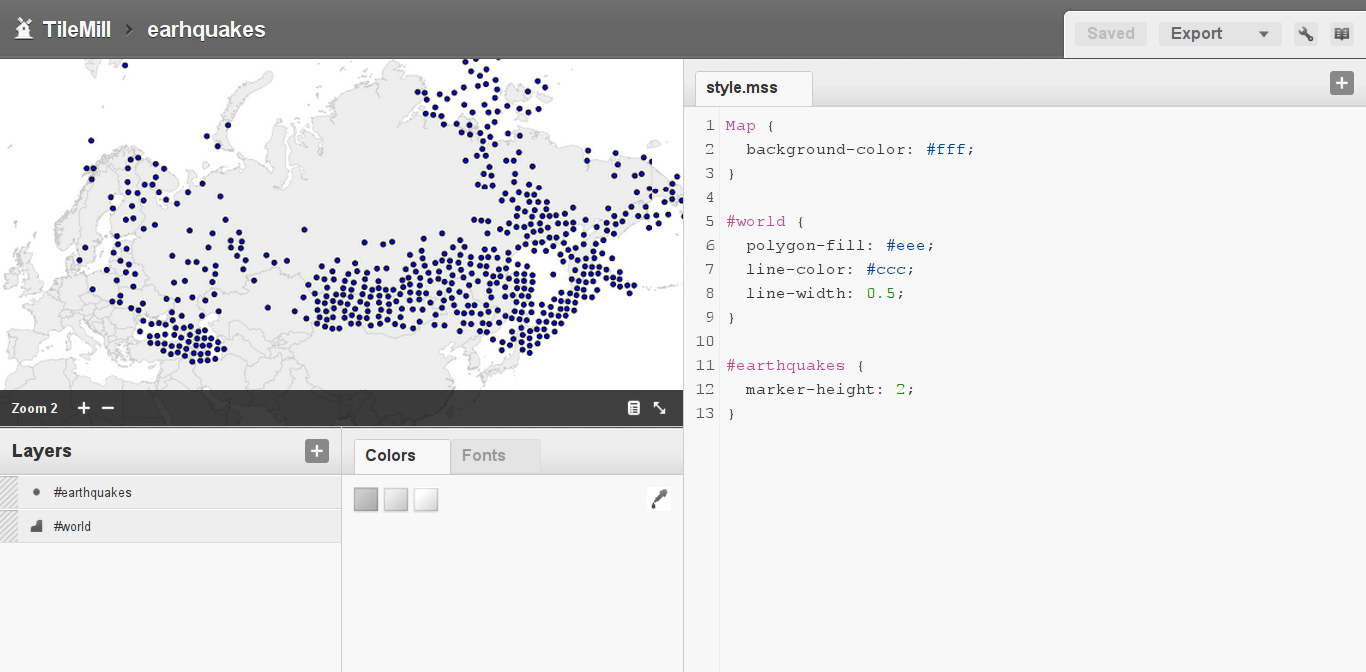
Add a layer. ID is a unique identifier for a layer in a project. Datasource - zip archive with a collection of shape files.

You can quickly check the correctness of a layer with points using the marker-height property (or marker-width).
The attribute table of the layer can be viewed by clicking the icon with the image of a magnifying glass, in the section with the active layers.

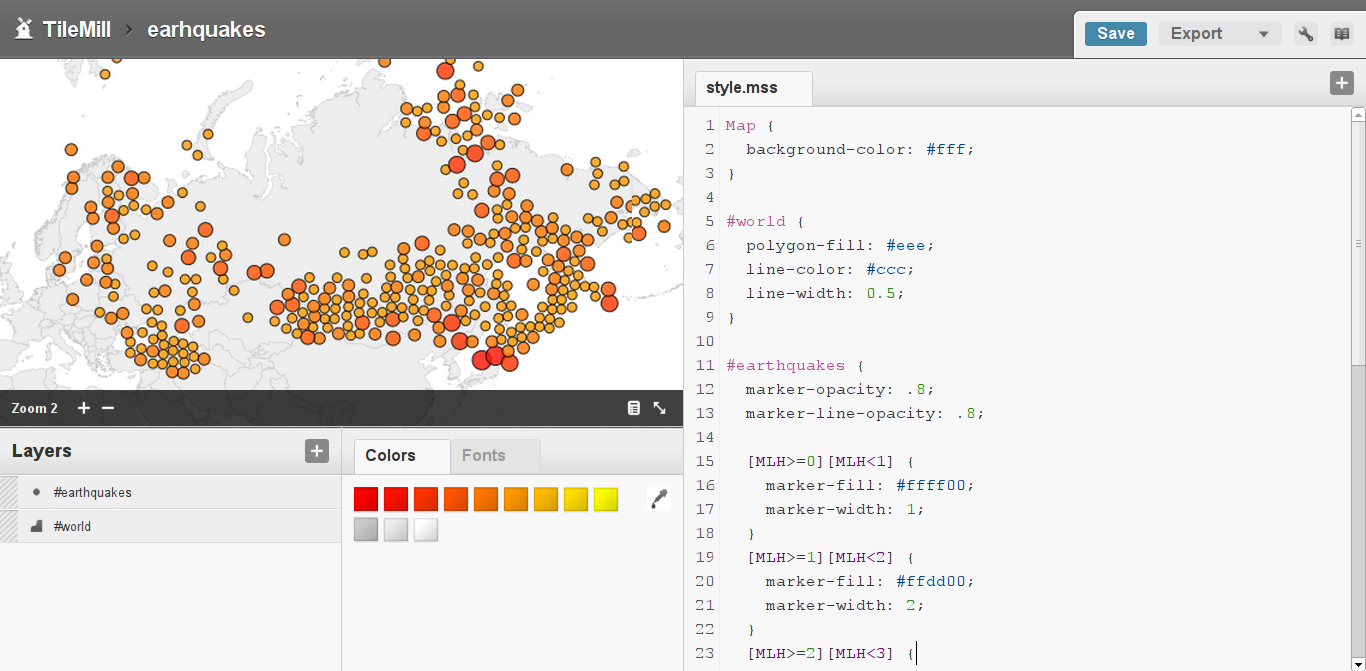
Fields from the attribute table can be used as selectors. As you can see, there is an earthquake magnitude in the layer attribute table (MLH field). Let's specify a different color and size for points with different magnitudes. I will give only a part of the code so that the general principle is clear.
[MLH>=0][MLH<1] { marker-fill: #ffff00; marker-width: 1; } [MLH>=1][MLH<2] { marker-fill: #ffdd00; marker-width: 2; } [MLH>=2][MLH<3] { marker-fill: #ffbb00; marker-width: 3; } In addition, there is a set of standard selectors that are used in TileMill.
* { } - for all layers.red { } - all layers with class 'red'.blue[zoom>8] { } - layers with a 'blue' class, with a presentation level above 8#countries[NAME='USA'] { } - all elements of the layer with the identifier 'countries', for which the attribute 'NAME' is equal to the value 'USA'In addition, let's make the markers and their borders a bit transparent:
marker-opacity: .8; marker-line-opacity: .8; Here's what we get in the end.
That's all. Our first project is ready.
In the next post I will talk about how to add interactivity to the project, how to create a legend and how to use it all. Thanks for attention.
UPDATE : continued .
Source: https://habr.com/ru/post/121126/
All Articles