Report-Driven Design
 This article discusses an alternative approach to building applications and implementing a database structure.
The main idea of this approach is that the application development process is based on the analysis of reports that should be generated by a ready-made business application.
We call this approach RDD - Report-Driven Design .
')
In the beginning was the report
In Developer Express, we are creating various components, including those that implement what is called Business Intelligence or Business Analitycs, namely, data analysis and processing. Therefore, we have a great experience in communicating with users creating business applications, and one of the main tasks for these users is to generate reports.
Communicating with these users, we unexpectedly discovered a number of problems that often arise when implementing a reporting module in a typical business application.
For example, it often happens that almost everything has been implemented in an application. And now, when it comes time to create reports, it turns out that to make many of them is quite problematic.
This is mainly due to the fact that some links were not thought out when designing the database. Or vice versa, the database is overly complicated: there are many unnecessary links in the tables, most of which are not used to create reports.
In addition, this problem may be expressed in the fact that, due to the non-optimal database structure, the processing of SQL queries for creating reports takes too long. This could happen, for example, because initially more attention was paid to how information would be entered, and not how best to display it.
Agree, this happens quite often. Then a reasonable question arises: “Why not take care of the reports from the very beginning? Why not make them the main goal when designing an application, if this is exactly what we need in the end? ”
What is a report?
Let's first define what we mean by report.
What associations do you have in your head at the word report? Probably, these are pages with some data presented in tabular or other form, which is convenient for further analysis.
At the same time, it is absolutely clear that a report is not necessarily a printed version. It could be a file, be it xls, pdf, doc or even a web page. It is clear that the report may contain not only tabular or cross-tabular data (the so-called pivot tables), but also graphs, and a lot of other information, which may also be useful for analysis.

Thus, the report we understand any page with information.
Four "I"
So, what is the development process for Report Driven Design? First of all, we understand it as an iterative process, which makes it similar to other Agile practitioners .
In doing so, we formulate the basic concept of RDD in the form of four I:
- Information
- Interaction
- Input
- Iterate (Go to the next)
Now I will explain what it all means.
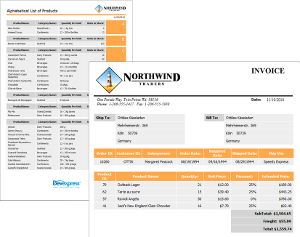
Before you start designing a program and a database for it, you need to receive from the customer a set of typical reports that need to be generated. Then you take one of these reports and analyze what information is presented in it:
- horizontal information signals which columns may be in the corresponding table;
- vertical data change gives an understanding of what information should be stored in rows;
- and grouping data in the report gives an idea of what fields to group should be entered and whether or not they should be placed in a separate table.
Moving on to the next item: Interaction . Here it is important to understand how the data from the current report interacts with the information obtained from the analysis of previous reports, and how you can modify the current structure so that it is equally useful for both the analyzed report and for all previous reports.
With the point of Input , I think, everything is also clear. Here you need to decide how the user will enter the information presented in the report. Since we go to designing an application from the end, from the report module, in fact at the Input stage we will do what is often implemented at the very beginning - the data entry form.
Well, the last point - Iterate : go to the next report and repeat all the steps again.
I admit that at first such a procedure may seem inappropriate to you, at least for your particular case. But if in your application report generation takes a special place, then you can safely try to apply RDD and make sure that it works .
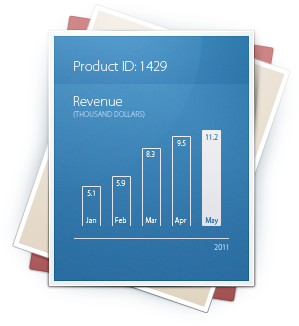
Let's take a look at how RDD works in a “live” example. To illustrate, let's take typical tasks from the life of an online store.
Example 1: Warehouses
Assume that when creating an online store, a program was written that allows you to enter data about the goods in the warehouse of this store. Information is quickly and conveniently entered into a database on a server that is located in the same warehouse.
Then, the same store has 2 other warehouses, already with a different assortment of goods. And there they began to use the same approach - a server with a program where operators enter information about the product. Total we have 3 different warehouses with 3 databases.
Now we will try to implement a typical report from the administration module. This report will display information about the availability of different products in existing warehouses. Looking at such a report, it becomes clear that if these data are stored in different databases, physically distant from each other, then it can take a long time to form.
Thus, it would be perfectly logical to combine all these tables into one database and locate it in the same local network with a report generation application.
It is possible that data entry will slow down (if the operator is located in another local network), but not much, and the report generation will increase significantly.
Now go ahead and move on to another report. This is a typical report for the user of the online store, which is a list of products ordered by the user.

It is absolutely clear that he is not at all interested in information about the warehouse where the goods ordered by the user are stored. So, we can combine all these products into one table. And so that information about the warehouse does not disappear at all, you can enter one more column in this table - the warehouse ID.
Example 2: Voting
Now consider another example of the task of creating an online store. This is the so-called Rating Control - element for voting, for example, for the evaluation by the buyer of the selected product.
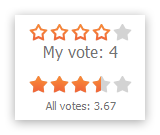
The algorithm here is simple: any user can vote for any product once. Following this scenario, we record each such vote in our table.
| CustomerID | ProductID | Rating |
|---|---|---|
Now we need to see what reports we need based on this data.
For example, the table above will be very useful if we need a report that contains information about how a particular person voted for different products.
If there is no such report in our list, that is, the information on a particular voter is not important to us, but information on a specific product is important, then we can safely remove the CustomerID field from this table.
| ProductID | Rating |
|---|---|
(If we still want to save information on which products the person voted for - and we want to prevent him from voting again - then we can store this data either in a separate CustomerID + ProductID table, or add another RatedProducts column to the Customers table and store this information there in the form of meta data)
Moving on, we can suddenly realize that the above report is either not very important to us or not needed at all.
And it is much more important for us to optimize the operation of the application so as to quickly display information about the current rating on the product page. Then we can significantly simplify our table, saving not all the votes that were, but their sum, as well as the total number of users into which this sum should be divided.
| ProductID | TotalRating | CustomersNumber |
|---|---|---|
There remains only a division operation, which will be performed each time the information about the current rating of the product is displayed. Fine.
How often will this information be shown? Very often - after all, a lot of users can “browse” the catalog of products (for example, 20 products per page), comparing their rating.

The question of backfilling : can we get rid of the division operation in this case? ;-)
Answer : we can store not the sum of all votes, but the current rating. Then the division operation will be needed at the moment of voting, that is, again when entering data. Here is the formula:
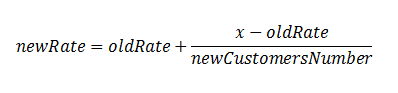
where x is the user's voice.
TOTAL
In conclusion, I can say that we do not propose using this approach as a panacea for all ills. However, in certain situations it may well be useful and will allow you to look at your application and your data from the other side. Try using it at least once, and I hope it will be useful to you.
PS
By the way, if you are going to visit DevCon'11 this week, I’m ready to personally discuss the pros and cons of this approach with you. On the second day of the conference, I will give a talk on RDD and I will be very happy to hear your opinion, well, just shake hands with all the real habrovtsam.
See you at DevCon!

Source: https://habr.com/ru/post/119876/
All Articles