Another Canvas Guide [1]: Canvas Element, Rectangles, Paths
Why another manual?
Because most of the existing manuals only look at the basics, and everything else has to be assembled in pieces, so I decided to write a concise, complete guide to the canvas for programmers (and they often write for ordinary people who learn programming as well).
From this page with the search engines went

Canvas element
The Canvas element has the name 'canvas' (well, who would have thought) and the attributes 'width' and 'height', and it’s worth noting that these attributes are not related to CSS, they mean the width and height of the canvas element in pixels not on the screen, and on the coordinate plane of the canvas. In addition, the text inside the tag will be ignored by the browser with support for canvas and displayed in a browser without support for canvas.
Later in this tutorial, we will use the following preset.
<!doctype html> <html> <head> <title> </title> </head> <body> <canvas id="cnv" width="600" height="600"> </canvas> <script type="text/javascript" src='your_file.js'></script> </body> </html> Drawing to canvas occurs through a context that can be obtained by calling the canvas method of the getContext element with argument '2d'.
So add a line to our script.
var ctx = document.getElementById('cnv').getContext('2d') ')
Rectangles
Canvas rectangles are the only primitive. There are only 3 methods for working with rectangles.
Fill the rectangle
fillRect - draws a filled rectangle, consider its arguments
fillRect(float x, float y, float w, float h) Where x and y are the coordinates of the upper left corner, and w and h are the width and height, respectively. Let's take an example. Add a line to the script.
ctx.fillRect(200, 250, 200, 100) As many have guessed, a rectangle 200 pixels wide and 100 pixels high will be drawn in the center of the canvas after running.
Draw a rectangle
StrokeRect works exactly the same as fillRect, but unlike it does not fill a rectangle, it draws only contours. Add a line to the script.
ctx.strokeRect(150, 200, 300, 200) Now around the filled rectangle we drew the contours of another one.
Clear the rectangle
clearRect - accepts the same arguments, but unlike its brothers, it does not draw, but destroys everything that happened before, as if we didn’t draw anything there. Let's remove part of the filled rectangle,
To do this, add a line to our script:
ctx.clearRect(350, 300, 50, 50) Thus, we cut a part of the filled rectangle.
Paths
Unlike rectangles, in order to draw or fill a path, you need to perform several actions, for simplicity, we will look at the main methods, get the finished result in a few steps, and then increase the base of the studied methods. To begin with, let's clean up our script and leave only the receiving context.
Getting started
The first step to creating a path is to call the beginPath method, after its call we add sub-paths (curves, straight lines) that are stored in a special list and after each call to beginPath this list is reset. So let's add a line to our script:
ctx.beginPath() Go to the point
moveTo(float x, float y) - moves the cursor position to (x; y).Add a line to our script:
ctx.moveTo(200,200) We lead the line to the point
lineTo(float x, float y) - draws a line from the position of the cursor to (x; y).For example, add a line to our script:
ctx.lineTo(400,400) Circling
The final moment will be a call to the stroke method to show the line on the canvas. So add a line to the script:
ctx.stroke() Now, if we open our example, we will see that the line is drawn on the canvas.
We are closing
If we draw some shape and we need to make it closed, we can use the closePath method. For example, let's draw a triangle, for this we leave in our file only context retrieval and insert the following lines there:
ctx.beginPath() ctx.moveTo(200,200) ctx.lineTo(400,400) ctx.lineTo(200,400) ctx.closePath() ctx.stroke() If we open a file that draws a triangle. In this case, we only had two lines, and closePath drew a third to close the figure.
Fill
In addition to drawing contours, we can also fill the shape, for this we simply replace the stroke function call with the fill call in our script. In this case, if you fill the shape, it is not necessary to explicitly close the shape by calling closePath, because when you call fill, the shape will close automatically.
Dougie
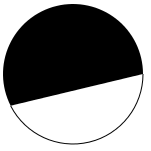
arc(float x, float y, float r, float startAngle, float endAngle, bool anticlockwise) - draws an arc with center at the point (x; y), radius - r, starting angle and ending startAngle, endAngle, respectively, and if anticlockwise = true, then part of the circle goes counterclockwise, otherwise in its direction.:For example, let's draw a partially filled circle, for this we clear our script, leaving only the receiving context. Then add the following lines.
ctx.beginPath() ctx.arc(200,300,70,0,Math.PI*0.85,false) ctx.stroke() ctx.beginPath() ctx.arc(200,300,70,0,Math.PI*0.85,true) ctx.fill() Slightly different arc
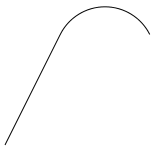
arcTo(float x1, float y1, float x2, float y2. float r) - draws an arc with radius r enclosed between two segments - AB and BC, where point A is the cursor position, B = (x1; y1) C = (x2; y2)Let's for example leave in the script only context retrieval and add the following lines:
ctx.beginPath() ctx.moveTo(200,300) ctx.arcTo(300,100,400,300,50) ctx.stroke() Quadratic curves

quadraticCurveTo(float x1, float y1, float x2, float y2) - draws a quadratic curve formed by three points (cursor position, (x1; y1), (x2; y2)).For example, let's see what to execute the following code:
ctx.beginPath() ctx.moveTo(100,100) ctx.quadraticCurveTo(200,200,50,200) ctx.stroke() Bezier curves

bezierCurveTo(float x1, float y1, float x2, float y2, float x3, float y3) - draws a cubic Bezier curve . For example, add the following code to our script: ctx.beginPath() ctx.moveTo(100,100) ctx.bezierCurveTo(200,200,100,300,50,100) ctx.stroke() Again about the rectangles
rect(float x, float y, float w, float w) - it works absolutely identical to fillRect and strokeRect, but unlike them it only adds a rectangle to the path.Now that we have learned the basics of drawing paths, we have two more important methods left to explore when working with paths.
Is that a point on the figure?
isPointInPath(float x, float y) - returns true if the point with the transmitted coordinates is inside. This method is very good to use to test clicking on some sort of figure, but for example we will set all values manually. Add the following lines to our script: ctx.beginPath() ctx.rect(200,200,100,200) console.log(ctx.isPointInPath(250,250)) console.log(ctx.isPointInPath(100,100)) This script should display true and then false in the debug console.
We limit the rendering area

In addition to the stroke and fill functions for working with paths, there is also a clip function, it draws nothing but nevertheless performs an important role, after calling it, any object will be drawn only when it is in the area on which the path is defined, let's consider a small example:
ctx.beginPath() ctx.arc(200,300,70,0,Math.PI*2,true) ctx.stroke() // ctx.clip() // ctx.beginPath() ctx.moveTo(100,320) ctx.lineTo(500,320) ctx.lineTo(100,250) ctx.stroke() // , In the near future (in theory in part in two days)
Stylization, gradients and shadows
Drawing pictures and text
Transformation and composition
Animation and imageData manipulation
Source: https://habr.com/ru/post/119238/
All Articles