Musical lighting of the optical glass collection
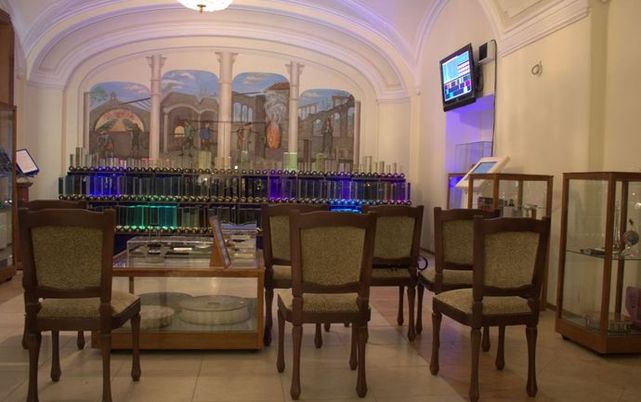
In the Optics Museum of St. Petersburg State University ITMO there is a rather remarkable exhibit - the Abbe catalog, which is a collection of optical glasses of various brands and sizes. The management of the museum wanted this catalog to be illuminated to the music, so the project of the musical backlighting of the catalog, which I actually dealt with, was born. This is something akin to the task of flashing an LED using a microcontroller, only larger.
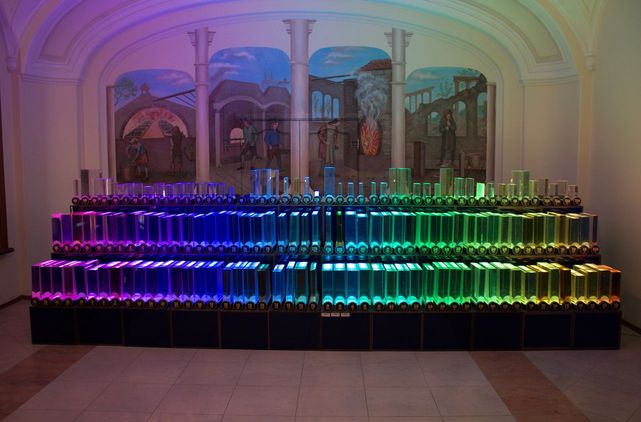
The hardware was developed by LMT . Under each glass is an LED ruler connected to the controller. The controllers are connected via a twisted pair to a network connected to a hub, which in turn is connected via USB to a computer.
')
My task was to develop software that would form an image using LED bars in accordance with the currently playing music. Those. simple audio player that could visualize the audio and at the same time would have an interface designed for a touchscreen. I don’t see any reason to talk about the program as a whole, so I’ll focus on the sound part.
The SFML library was used to work with graphics and sound, and FFTW was used to perform a fast Fourier transform.
In order to extract any information from the audio signal, you must have direct access to the audio samples. With the help of the SFML + libsndfile bundle, this was easy to implement.
During playback of an audio file with a certain frequency (in this case, this is the frame rate), a small section of the array with samples is taken and then a fast Fourier transform is performed on it. Thanks to the FFT, an array with frequency data is obtained from the array with the sound wave data. In the case of performing a real conversion, the size of the resulting array will be two times smaller than the original one.
Some pieces like this are needed:

One thing to consider here is that in order to accurately track the bass notes, a fairly large data array is needed to transform the Fourier transform. According to my calculations, in order to be able to begin work from the A-second octave, an array of size 8096 was required. With a sampling frequency of 44100, this is approximately 0.2 seconds, and this is a rather large interval and no longer sounding notes can get into it. Therefore, in this case, you should resort to a little trick, told even in textbooks on digital signal processing - take a small array and add it with zeros to the desired size. This slightly changes the result, but in this case it was not critical.
This is what kind of data the FFT actually performs:

To obtain a spectrum, it is necessary to square all the elements of the resulting array, then, based on the size of the array and the sampling frequency, it is easy to determine in which elements of the array the amplitudes of which frequencies are located, since in the last element of the array, the amplitude of the Nyquist frequency will be equal to half the sampling frequency, and before that - with a step corresponding to the number of elements. Subsequently, the values of the amplitudes of frequencies as close as possible to the frequencies of musical notes are selected from them.
The spectrum obtained as a result of processing an array of audio samples:
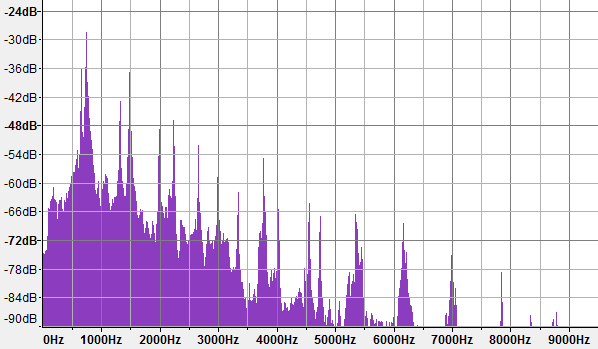
Further, a little more processing - tracking peaks, exceeding the value of the minimum sensitivity limit, converting the amplitude value into a brightness value. After that, you can proceed to the formation of the image.
Because the resolution of the “screen” is small - 48x3, then there are no many options for the spatial arrangement of notes. But two ideas came in right away. In one embodiment, the columns of three glasses are combined and represent one note, outwardly it turns out something remotely resembling a piano keyboard. In the second version, two glasses standing side by side in the same row represent one note, this is closer to the guitar with three strings and an extremely unusual tuning;)
The last part - the formation of color. Almost immediately it became clear that working with the HSV color model here is much more convenient than with RGB, since basically it was necessary to control the tone. One of the simplest and most logical methods of sound visualization was proposed by Newton - according to his idea, the visual spectrum corresponds to one octave. Newton's method is presented in the image below on the right:
After experimenting, this idea was developed further - in different modes, the entire visible spectrum or its part is superimposed on a different number of octaves. For example, 60 degrees of tone by four octaves, plus an additional constant time offset of the initial degree.
Another color generation method was borrowed from web design. In it, the color palette is selected using one of the templates.
Here are some examples:
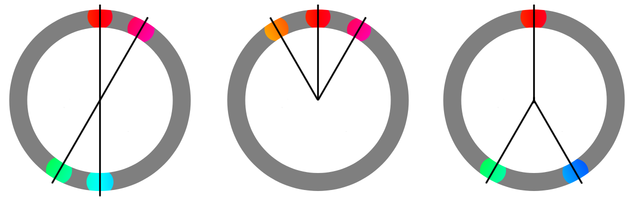
Using this method, you can create more contrast images. As in the previous method, the main tone can be shifted in time.
System video (available in FullHD):
References:
1. Luke Nimtz, Primary Harmonics - Music / Color Theory
2. Visual music blog
Students and applicants - such things (and not only such) can be dealt with in the master's program at SPbIITMO, in the direction “Embedded Computing Systems”
The hardware was developed by LMT . Under each glass is an LED ruler connected to the controller. The controllers are connected via a twisted pair to a network connected to a hub, which in turn is connected via USB to a computer.
')
My task was to develop software that would form an image using LED bars in accordance with the currently playing music. Those. simple audio player that could visualize the audio and at the same time would have an interface designed for a touchscreen. I don’t see any reason to talk about the program as a whole, so I’ll focus on the sound part.
The SFML library was used to work with graphics and sound, and FFTW was used to perform a fast Fourier transform.
In order to extract any information from the audio signal, you must have direct access to the audio samples. With the help of the SFML + libsndfile bundle, this was easy to implement.
During playback of an audio file with a certain frequency (in this case, this is the frame rate), a small section of the array with samples is taken and then a fast Fourier transform is performed on it. Thanks to the FFT, an array with frequency data is obtained from the array with the sound wave data. In the case of performing a real conversion, the size of the resulting array will be two times smaller than the original one.
Some pieces like this are needed:
One thing to consider here is that in order to accurately track the bass notes, a fairly large data array is needed to transform the Fourier transform. According to my calculations, in order to be able to begin work from the A-second octave, an array of size 8096 was required. With a sampling frequency of 44100, this is approximately 0.2 seconds, and this is a rather large interval and no longer sounding notes can get into it. Therefore, in this case, you should resort to a little trick, told even in textbooks on digital signal processing - take a small array and add it with zeros to the desired size. This slightly changes the result, but in this case it was not critical.
This is what kind of data the FFT actually performs:
To obtain a spectrum, it is necessary to square all the elements of the resulting array, then, based on the size of the array and the sampling frequency, it is easy to determine in which elements of the array the amplitudes of which frequencies are located, since in the last element of the array, the amplitude of the Nyquist frequency will be equal to half the sampling frequency, and before that - with a step corresponding to the number of elements. Subsequently, the values of the amplitudes of frequencies as close as possible to the frequencies of musical notes are selected from them.
The spectrum obtained as a result of processing an array of audio samples:
Further, a little more processing - tracking peaks, exceeding the value of the minimum sensitivity limit, converting the amplitude value into a brightness value. After that, you can proceed to the formation of the image.
Because the resolution of the “screen” is small - 48x3, then there are no many options for the spatial arrangement of notes. But two ideas came in right away. In one embodiment, the columns of three glasses are combined and represent one note, outwardly it turns out something remotely resembling a piano keyboard. In the second version, two glasses standing side by side in the same row represent one note, this is closer to the guitar with three strings and an extremely unusual tuning;)
The last part - the formation of color. Almost immediately it became clear that working with the HSV color model here is much more convenient than with RGB, since basically it was necessary to control the tone. One of the simplest and most logical methods of sound visualization was proposed by Newton - according to his idea, the visual spectrum corresponds to one octave. Newton's method is presented in the image below on the right:
After experimenting, this idea was developed further - in different modes, the entire visible spectrum or its part is superimposed on a different number of octaves. For example, 60 degrees of tone by four octaves, plus an additional constant time offset of the initial degree.
Another color generation method was borrowed from web design. In it, the color palette is selected using one of the templates.
Here are some examples:
Using this method, you can create more contrast images. As in the previous method, the main tone can be shifted in time.
System video (available in FullHD):
References:
1. Luke Nimtz, Primary Harmonics - Music / Color Theory
2. Visual music blog
Students and applicants - such things (and not only such) can be dealt with in the master's program at SPbIITMO, in the direction “Embedded Computing Systems”
Source: https://habr.com/ru/post/118618/
All Articles