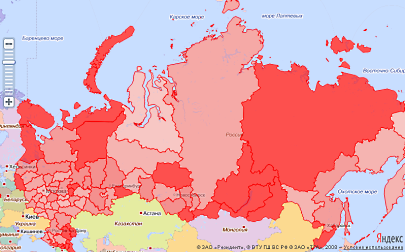
An example of a choropleth card based on Yandex maps
The fact that such horoplet was briefly described in the article Thematic Maps .
In this article, I decided to give a small practical example of implementing a choropleth card based on the Yandex.Maps service. You can say this is something that can be done "in five minutes."
The example has some cognitive value, because presents relatively recent data on the unemployment rate by region of the Russian Federation.
I repeat once again that such horoplt. Choropleth is a map on which the intensity of a certain indicator is shown by shading, points of different thickness or color of different degrees of saturation for different areas. The areas in this case are usually the objects of administrative-territorial division.
')
Relatively recently, Yandex.Maps have added the Regions module, allowing to highlight and select the administrative area on the map. This function itself, from the point of view of the choropleth, is of no particular use, however, since when using the module, the coordinates of the regions are available; you can use this and draw polygons according to the given coordinates with different styles.
Now for the Russian Federation, Yandex returns a list consisting of 81 regions, from the Altai Territory to the Yaroslavl Region. Each record of a region includes its name and one or more polygons that describe the boundaries.
As useful data, we take the column “Unemployment rate,%” from the table “Economic activity of the population aged 15-72 years (according to sample surveys of the population on employment problems, on average, December 2010 - February 2011)” from www.gks .ru . Choose a way to display the indicator in the form of color, going from light from 0% to saturated red in the value of 10%. All regions that have a value greater than 10% will be displayed in the same fill style.
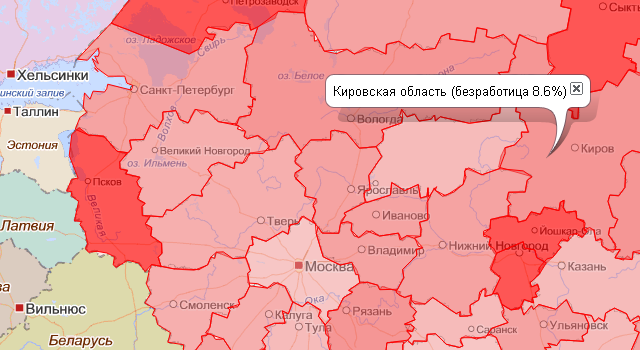
Now we have all the parts of the construction we need: a cartographic basis, the boundaries of the regions, data by region and intensity scale. We bring them together and we get something like this:
The demonstration is available at the link: http://static.streetjournal.org/choropleth.html , and the JavaScript code can be viewed at the link: http://static.streetjournal.org/choropleth.js .
Clicking on a region will display a comment.
It is worth noting that in Internet Explorer when loading data can be observed braking, so when using it, you should wait a little while opening the page. Google Chrome with the amount of data used works well.
Source: https://habr.com/ru/post/118267/
All Articles