Themed Cards

The development of cartographic services on the Internet has spurred the interest of developers in creating their own geo-information services, including those based on crowdsourcing. Using the finished substrate (base), i.e. data in the form of satellite images and maps, it is relatively easy to increase the visibility of the data in your own system and to extend the functionality.
An important point is the way the data is displayed so that the picture of the phenomenon being monitored is easy to understand. Organizers do not always adequately use display tools due to technical limitations or other problems.
In fact, integration with map services leads to the creation of a thematic map. What it is and the most popular ways to build thematic maps will be described below. Also in the text are English terms that can be used to find additional information.
Thematic map ( Thematic map ) - is a map for displaying a narrow (thematic) circle of being distributed over the surface and tied to points, regions, administrative entities, etc. Various methods can be used to display these phenomena.
')
Among all the options for displaying data, the following methods of mapping are most popular: icons, chart diagrams, cartograms, and isolines. It should be noted that the transition from paper to electronic maps also influenced the ways of display, because on electronic maps, as a rule, there is interactivity and the ability to create animation.
The way of image icons
The easiest and undemanding method of displaying information. Apply to data that are tied to a certain point, or for which the accuracy of the display area is not important. Used to display points of interest ( POI ).
It should be noted that in the most well-known geo-services and libraries (Google Maps, Yandex Maps, OpenLayers) this type of display is maintained well and without much difficulty you can create your own thematic map with icons.

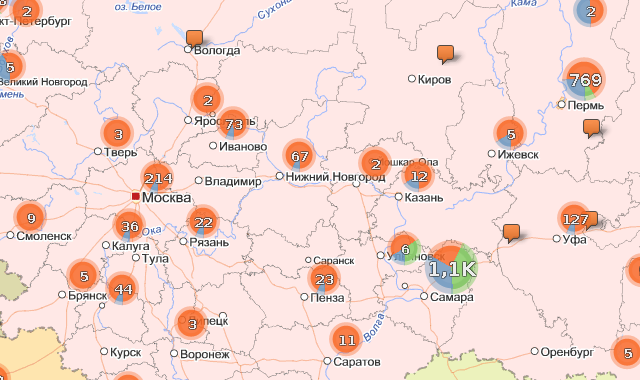
Chart chart
Chart diagrams are a combination of charts with a geographic map. Chart figures (bars, squares, circles, figures, stripes) are used as pictorial marks in cartodiagrams and are placed on a geographic map.
A popular and simple way to display cartodiagram is the use of symbols, the size of which depends on the displayed proportional symbol . Most often in this role you can meet circles that are compact, easily scaled, and also they are easy to perceive.

Also popular, but more complicated, is the use of pie charts ( pie chart maps ), when you additionally need to show the ratio of several quantities. It should be noted that the pie chart is clear only if the number of parts of the aggregate of the chart is small. If there are too many parts of the diagram, its application is ineffective due to the insignificant difference of the compared structures.
Cards diagrams are used when you can neglect the size of the area for which indicators are displayed, since the icons and diagrams do not show its actual size.
Cartogram
A cartogram is a map on which the intensity of an indicator is shown by hatching, dots of varying thickness or color of different degrees of saturation for different areas. The areas in this case are usually the objects of administrative-territorial division (districts, cities, countries, etc.). Since it is more difficult to operate with information about administrative division than with points, cartograms are less common than the two previous display methods.
For the above definition, a choropleth is synonymous with a cartogram.

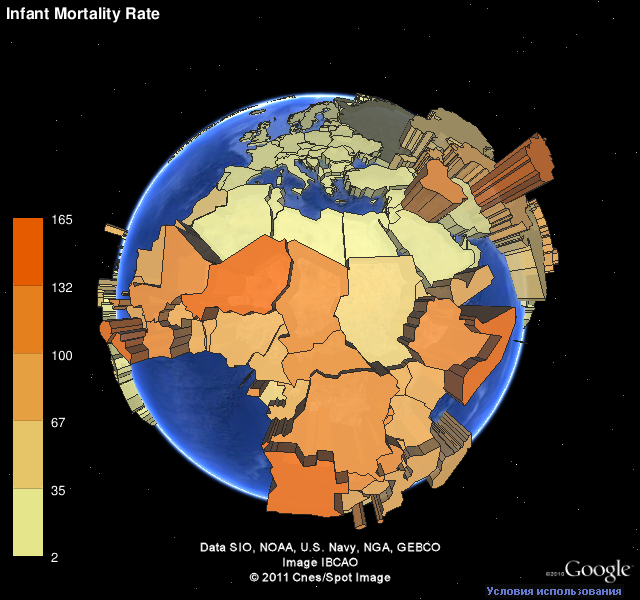
A special type of choropleth is a “prism map” ( prism map ), in which the height of the region is proportional to the displayed value.
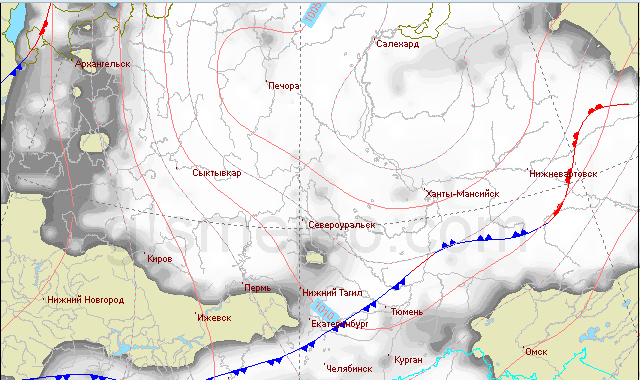
Isolines Map
The map with isolines ( contour, isoline, isarithm map ) illustrates the dependence of the measured value using lines, where at each point this value keeps the same value. The map with isolines is even more rare due to the complexity of construction.
Conclusion
The above are the most popular, but, of course, not all ways of building thematic maps. Due to the availability of map services, this area is actively developing. One can only wish that the creators of such services would improve the basis for building thematic maps, and those who use these services would create convenient systems based on them.
useful links
1. Thematic Cards (English)
2. Website on the use of thematic maps (eng.)
3. Horoplet cards on the Wiki (English)
4. Cartograms on the Wiki (rus.)
Source: https://habr.com/ru/post/118169/
All Articles