Chartwell - font chart
Recently, Chartwell , a set of OpenType fonts that allow interactively creating neat infographics, has come to light.
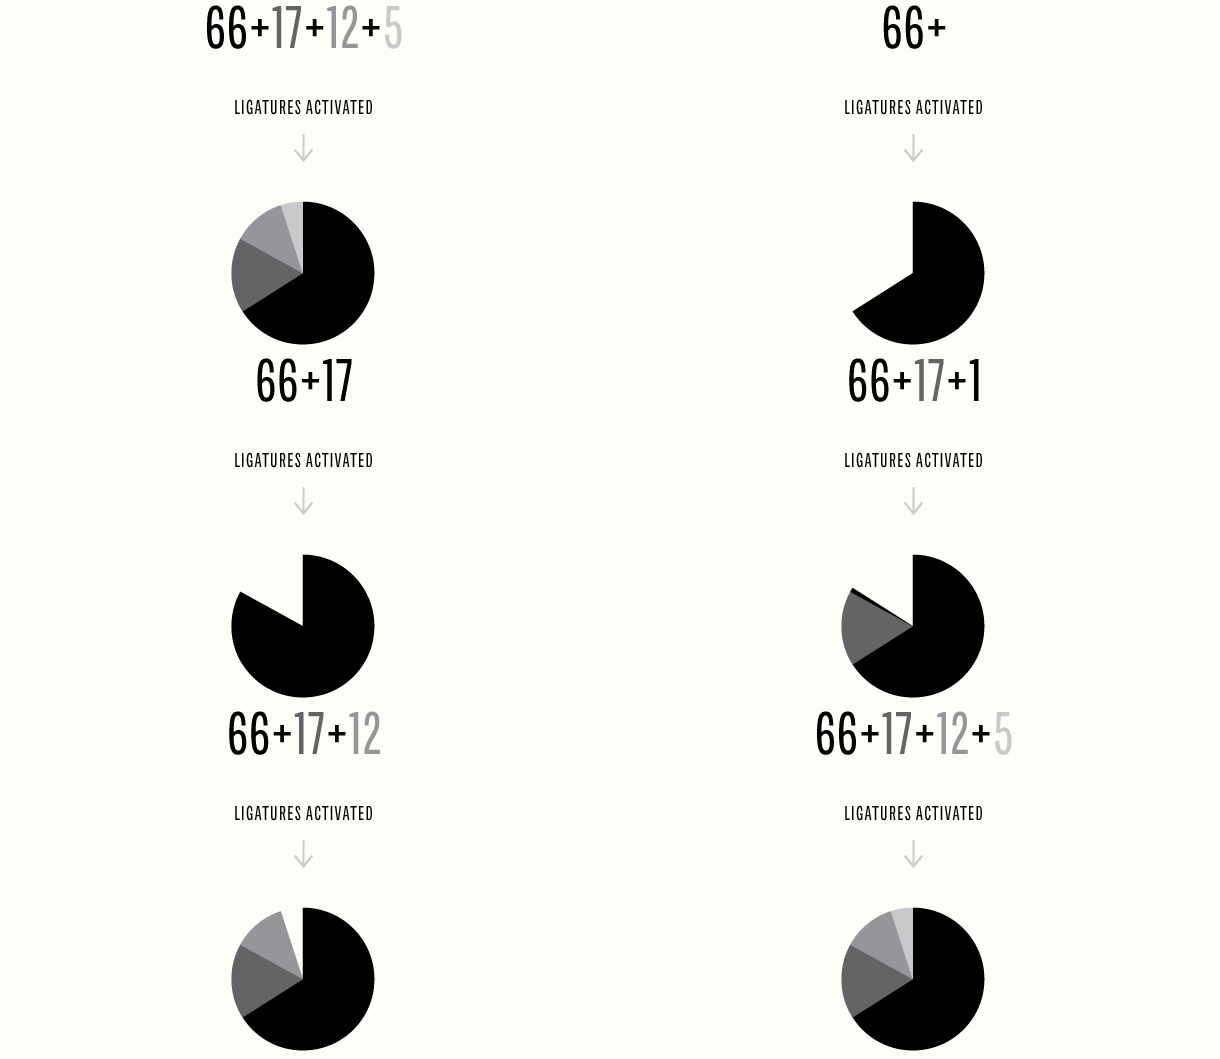
You type the necessary numbers, and the diagrams are drawn by yourself. Three styles are available: Pies, Bars, Lines. The chart can be colored to your own taste - the color of the number determines the color of the corresponding part of the chart.

')
Font at work

Support for different types of charts
All infographics in the font is implemented through ligatures . A ligature is a sign formed by the merging of two or more graphemes, for example: Æ, ʤ, ʣ. Sometimes ligatures can be transferred to their own character, as happened with the preposition “at”, which is now displayed with the “@” symbol.
The font is commercial and costs $ 15. To use it, you need a program that supports ligatures. This task is perfectly handled by popular programs from Adobe: Photoshop, Illustrator, Indesign.
In the web, the use of font data is still limited. From top browsers, ligatures only support FireFox 4.
You type the necessary numbers, and the diagrams are drawn by yourself. Three styles are available: Pies, Bars, Lines. The chart can be colored to your own taste - the color of the number determines the color of the corresponding part of the chart.

')
Font at work

Support for different types of charts
All infographics in the font is implemented through ligatures . A ligature is a sign formed by the merging of two or more graphemes, for example: Æ, ʤ, ʣ. Sometimes ligatures can be transferred to their own character, as happened with the preposition “at”, which is now displayed with the “@” symbol.
The font is commercial and costs $ 15. To use it, you need a program that supports ligatures. This task is perfectly handled by popular programs from Adobe: Photoshop, Illustrator, Indesign.
In the web, the use of font data is still limited. From top browsers, ligatures only support FireFox 4.
Source: https://habr.com/ru/post/117012/
All Articles