Database: View Top Activity without Enterprise Manager
 When there is development related to databases, there is almost always a need to see what the base is doing at this particular point in time.
If a developer approaches the database administrator and asks to see why his query “slows down”, then the experienced DBA will get hand-written scripts wrappers over hidden x $ views and instantly tell you what is causing the developer disorder.
But if the DBA is not so severe? Is he a beginner DBA or not a DBA at all, but just watching the base?
This will help him the tools described under the cut.
Enterprise manager
The most convenient way to see what the base is doing is to use Oracle Enterprise Manager. Or rather, if we are talking about a single database, Database Manager.
This is a web-based interface that allows you to view the status of the database, perform administrative actions and configure the database.
I think many people know the screen Top Activity:

Which shows what is currently going on in the database. It is comfortable, beautiful, and it can be shown to the authorities :)
But what if an OEM installation is impractical or the database is configured without an Enterprise Manager? This will help us
')
ASH Viewer
A free, small, graphical utility written in Java.
You can download Sourceforge: sourceforge.net/projects/ashv
Before the first start, you need to edit run.sh (or run.bat) and replace JAVA_HOME with the current one. You also need to attach a driver for Oracle DB (ojdbc14.jar) to lib / so that the program can connect to the database. In order to connect to the database, it is enough to know the SID / IP / port and user / password. After launch, we have a beautiful picture:
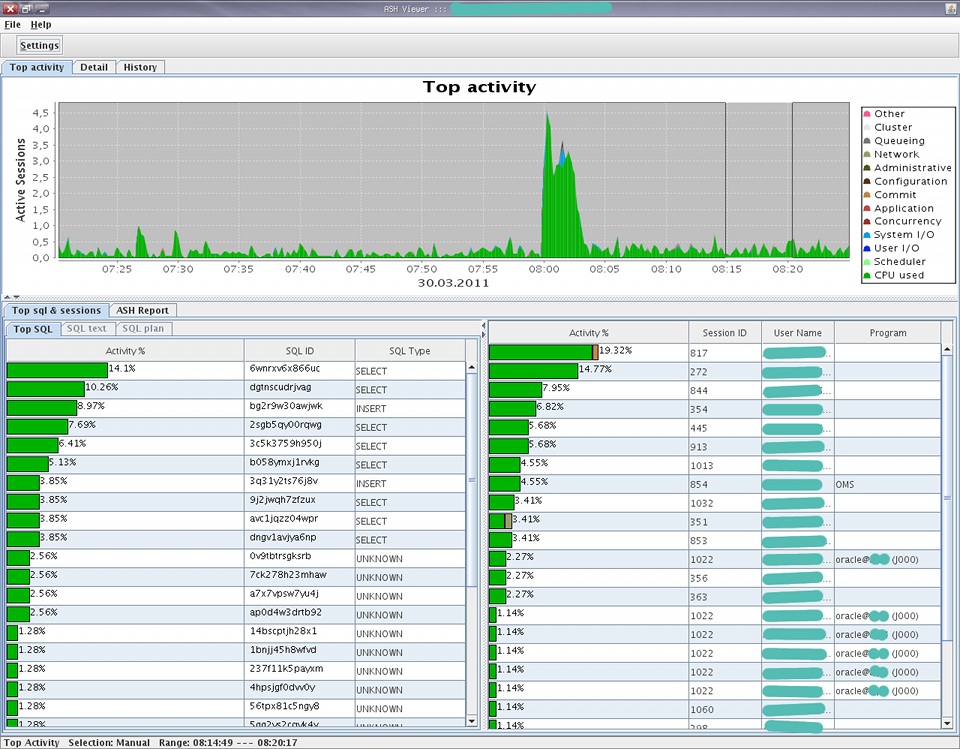
The interface practically repeats Top Sessions from the OEM and is therefore easy to learn.
When you hover the cursor over the SQL ID, a hint appears with the text SQL. The same SQL text can be viewed in the SQL Text tab:

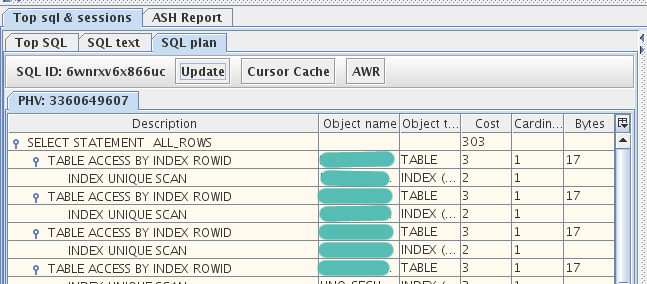
The request plan is also available in the corresponding tab:
Also available statistics about the cache and what events were at the selected point in time:

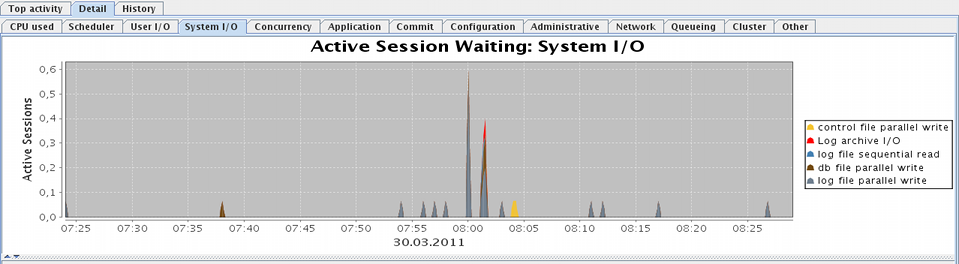
If you need to see the graphs for each class of metrics separately, there is a Detail tab:
All statistics are stored locally and in the future you can view statistics for the past days when ASH Viewer was launched:

The authors promise support for Oracle DB starting from 8i.
ASH Viewer is convenient if there is no access to the OEM and you can configure the firewall (or ssh tunnel) to access the database. However, these conditions are also not always met. And you may need to look at the database load when there is no ASHV installed nearby or when only SSH is at hand.
Output - monitoring on the server itself, for example through sqlplus. All you need is to use
MOATS
As the developers note, this abbreviation stands for The (M) other (O) f (A) ll (T) uning (S) cripts. The script provides the ability to monitor Top sessions and Top waits directly (and only) from the sqlplus console!
After a simple installation of the utility for a specific user, he will be able to observe a similar image directly from the console:
 + INSTANCE SUMMARY ----------------------------------------------- ------------------------------ +
 |  Instance: ora112 |  Execs / s: 2.0 |  sParse / s: 0.0 |  LIOs / s: 219637.3 |  Read MB / s: 0.0 |
 |  Cur Time: 13-Aug 19: 25: 14 |  Calls / s: 0.0 |  hParse / s: 0.0 |  PhyRD / s: 0.5 |  Write MB / s: 0.0 |
 |  History: 0h 0m 26s |  Commits / s: 0.0 |  ccHits / s: 1.5 |  PhyWR / s: 2.9 |  Redo MB / s: 0.0 |
 + ------------------------------------------------- ---------------------------------------------- +

 + TOP SQL_ID (child #) ----- + TOP SESSIONS - + + TOP WAITS ------------------------- + WAIT CLASS - +
 |  50% |  bwx4var9q4y9f (0) |  71 |  |  100% |  latch: cache buffers chains |  Concurrency |
 |  50% |  bq2qr0bhjyv1c (0) |  133 |  |  50% |  SQL * Net message to client |  Network |
 |  50% |  799uuu8tpf6rk (0) |  6 |  |  |  |
 + ------------------------------------------ + + ----- --------------------------------------------- +

 + TOP SQL_ID - + PLAN_HASH_VALUE + SQL TEXT ----------------------------------------- ------------ +
 |  bwx4var9q4y9 |  2119813036 |  select / * + full (a) full (b) use_nl (ab) * / count (*) from |
 |  |  |  ys.obj $ b where a.name = b.name and rownum <= 1000002 |
 + ------------------------------------------------- -------------------------------------------- +
 |  bq2qr0bhjyv1 |  644658511 |  select moats_ash_ot (systimestamp, saddr, sid, serial #, |
 |  |  |  audsid, paddr, er #, username, command, ownerid, taddr |
 + ------------------------------------------------- -------------------------------------------- +
 |  799uuu8tpf6r |  2119813036 |  select / * + full (a) full (b) use_nl (ab) * / count (*) from |
 |  |  |  ys.obj $ b where a.name = b.name and rownum <= 1000001 |
 + ------------------------------------------------- -------------------------------------------- +
I cut the example a bit wide so that it fits into the article. An example of use can be viewed in the author's video:
And you can download the script from the site: www.oracle-developer.net/utilities.php However, Oracle requires at least 10gR2 for its work.
UPD : Clarification on licensing some features. ASHV by default uses Active Session History (ASH) available starting at 10g. ASH is included in the Oracle Diagnostic Pack and must be licensed for ODP to use it.
But since ASHV also supports Oracle 9i (8i) on which the ASH functionality is emulated, when connecting to 10g, you can select the Standard database type and then ASH will be emulated to 10g (although some Diagnostic Pack functionality, such as AWR or ASH reports will be unavailable ).
Source: https://habr.com/ru/post/116490/
All Articles