How to choose VPS hosting
The trouble started from the moment when my favorite American hoster suddenly transferred my long-term account to a new server and set a tricky limit on php memory for the entire account. And at first glance, memory_limit 90M seems to be enough for any site, but this limit is valid for the entire account as a whole. Those. Sites located on the same account, begin to "smother" each other. Problems began with the phpbb forum attendance of just 2000 unique per day. At excess of a limit of memory the server gave 500 error.
Experienced people, without reading further, will immediately say that technical support offered me: of course, the transition to their VPS. For the domestic hosting is a common thing, but from the bourgeoisie, I heard this for the first time. In this case, there is only one way out - switching to another hosting, because with “terrorists there are no negotiations” and $ 15 for their 300Mb VPS seemed to be a little expensive.
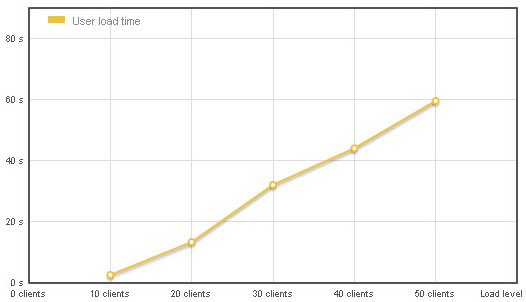
I chose Open VZ VPS in Russia 768Mb for ~ 500 rubles. All set, it seems to work. But then the devil pulled me before changing the DNS to check the load with the help of loadimpact.com and I was covered with a quiet horror: with simultaneous access to the site 50 visitors of the page were loaded for 60 seconds.
')
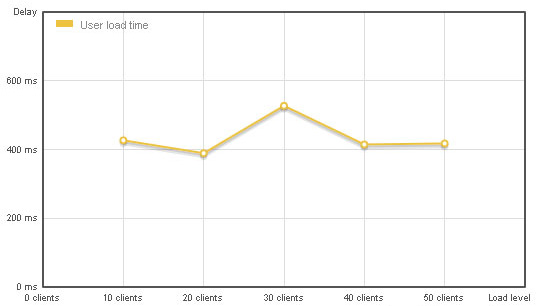
The memory, for all that, fluctuated around 300 MB (load average: 0.67 0.55 0.52). Quickly threw the site on Hyper V with the same parameters, and lo and behold:
Then I would think about it, my toad had already thought for me: Hyper cost twice as much and, it turned out, not without purpose.
Toad told me to put nginx on Open VZ, and it turned out a strange picture:
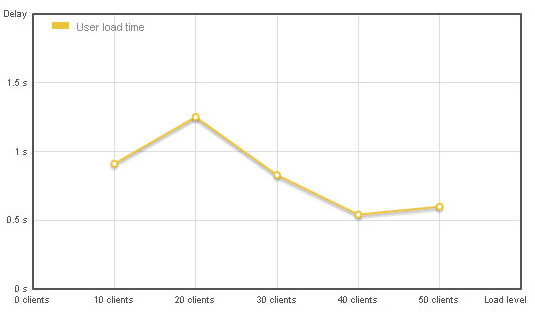
I have no administrator, so a cautious thought: why is it with a small load the response time is longer than with a high load? I did not have it. So happily rubbing the green paws, the toad and I set off to drink beer with the money saved.
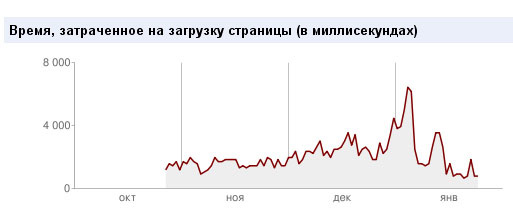
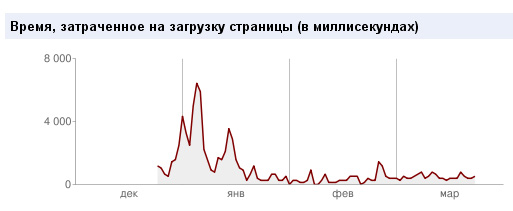
Days went by, and the page load time grew with them (data from google.com/webmasters):
I erased from my memory a month of struggle for the happy existence of my site at this hosting provider. A lot of things have been done: top, htop, iotop, atop, dstat. The head refuses to remember this whole mess. The only data that I could not get - is the load on the disk, because in Open VZ closed access to the system kernel. My modest conclusion is that there is a client on the server, which creates a serious load on the disk, preventing the rest from working normally. Why the hoster suffers such a situation, I did not understand.
Since the site I have standard resources VPS - memory and processor does not eat much, and in order not to get into the same situation with the disk, I decided to try out cloud hosting. Everything is beautiful on the fingers: how much you consume, you pay so much. Over time, everything got better:
But trouble came from the other side. The site began to constantly fall with an error Unknown reason (eg unexpected eof, timeout) - thanks to the host tracker for such information.
There is another free website monitoring service, basicstate.com , which prompted me to the idea that in the case of this cloud hosting there is traffic overselling.
date_________uptime____dns_____connect__request____ttfb______ttlb
2011-02-22 ____ 97.94 ____ 0.114 ____ 0.265 ____ 0.265 ____ 1.352 ____ 1.731
2011-02-21 ____ 97.94 ____ 0.285 ____ 0.553 ____ 0.553 ____ 1.821 ____ 2.270
2011-02-20 ____ 97.94 ____ 0.219 ____ 0.373 ____ 0.373 ____ 1.913 ____ 2.214
2011-02-19 ____ 94.12 ____ 0.079 ____ 0.234 ____ 0.234 ____ 1.500 ____ 1.792
2011-02-18 ____ 97.94 ____ 0.169 ____ 0.320 ____ 0.320 ____ 0.732 ____ 1.033
Those. inside the cloud everything is fine, everything flies. But the channel leading to the cloud is not rubber, and it is stupidly clogged with traffic from customers. Look at the difference between TTFB (Time To First Byte) and TTLB (Time To Last Byte). Theoretically, everything is correct, data has a volume, but they cannot pass through the channel instantly. It turns out that they can:
date_________uptime____dns_____connect__request____ttfb______ttlb
2011-03-03 ___ 100.00 ____ 0.063 ____ 0.214 ____ 0.214 ____ 0.672 ____ 0.672
2011-03-02 ___ 100.00 ____ 0.010 ____ 0.161 ____ 0.161 ____ 0.624 ____ 0.624
2011-03-01 ___ 100.00 ____ 0.004 ____ 0.154 ____ 0.154 ____ 0.607 ____ 0.608
2011-02-28 ___ 100.00 ____ 0.008 ____ 0.158 ____ 0.159 ____ 0.637 ____ 0.638
2011-02-27 ___ 100.00 ____ 0.010 ____ 0.255 ____ 0.255 ____ 0.734 ____ 0.734
2011-02-26 ___ 100.00 ____ 0.007 ____ 0.157 ____ 0.157 ____ 0.622 ____ 0.622
2011-02-25 ___ 100.00 ____ 0.007 ____ 0.158 ____ 0.158 ____ 0.617 ____ 0.617
2011-02-24 ___ 100.00 ____ 0.006 ____ 0.187 ____ 0.187 ____ 0.743 ____ 0.870
2011-02-23 ___ 100.00 ____ 0.031 ____ 0.183 ____ 0.183 ____ 0.878 ____ 1.028
2011-02-22 ____ 97.94 ____ 0.114 ____ 0.265 ____ 0.265 ____ 1.352 ____ 1.731
2011-02-21 ____ 97.94 ____ 0.285 ____ 0.553 ____ 0.553 ____ 1.821 ____ 2.270
2011-02-20 ____ 97.94 ____ 0.219 ____ 0.373 ____ 0.373 ____ 1.913 ____ 2.214
2011-02-19 ____ 94.12 ____ 0.079 ____ 0.234 ____ 0.234 ____ 1.500 ____ 1.792
2011-02-18 ____ 97.94 ____ 0.169 ____ 0.320 ____ 0.320 ____ 0.732 ____ 1.033
Data from February 23 is another cloud hosting with a normal channel and a small number of clients. Actually, this should be VPS hosting.
Summing up the VPS selection criteria, it should be noted that everyone will have to try the hard way, sometimes changing hosting services like gloves, because there is no other way to look inside. So, after installing the site on a VPS, do the following:
1) We check the load via loadimpact.com Check should be done immediately by IP, before changing DNS, because we check hosting, and not the site itself. The schedule should be smooth under any load, time is less than a second. Additionally, we look at the top results online in order to understand how much our site consumes memory and processor to select the optimal VPS configuration.
2) If on the first point everything is fine, then we change the DNS. We are watching the results of the host-tracker and basicstate.com for a week and if everything is approximately like this:
uptime _____ dns ____connect__request ____ ttfb______ttlb
100.00 ____ 0.063 ____ 0.214 ____ 0.214 ____ 0.672 ____ 0.672
Then we go to drink beer. Everything.
Experienced people, without reading further, will immediately say that technical support offered me: of course, the transition to their VPS. For the domestic hosting is a common thing, but from the bourgeoisie, I heard this for the first time. In this case, there is only one way out - switching to another hosting, because with “terrorists there are no negotiations” and $ 15 for their 300Mb VPS seemed to be a little expensive.
I chose Open VZ VPS in Russia 768Mb for ~ 500 rubles. All set, it seems to work. But then the devil pulled me before changing the DNS to check the load with the help of loadimpact.com and I was covered with a quiet horror: with simultaneous access to the site 50 visitors of the page were loaded for 60 seconds.
')
The memory, for all that, fluctuated around 300 MB (load average: 0.67 0.55 0.52). Quickly threw the site on Hyper V with the same parameters, and lo and behold:
Then I would think about it, my toad had already thought for me: Hyper cost twice as much and, it turned out, not without purpose.
Toad told me to put nginx on Open VZ, and it turned out a strange picture:
I have no administrator, so a cautious thought: why is it with a small load the response time is longer than with a high load? I did not have it. So happily rubbing the green paws, the toad and I set off to drink beer with the money saved.
Days went by, and the page load time grew with them (data from google.com/webmasters):
I erased from my memory a month of struggle for the happy existence of my site at this hosting provider. A lot of things have been done: top, htop, iotop, atop, dstat. The head refuses to remember this whole mess. The only data that I could not get - is the load on the disk, because in Open VZ closed access to the system kernel. My modest conclusion is that there is a client on the server, which creates a serious load on the disk, preventing the rest from working normally. Why the hoster suffers such a situation, I did not understand.
Since the site I have standard resources VPS - memory and processor does not eat much, and in order not to get into the same situation with the disk, I decided to try out cloud hosting. Everything is beautiful on the fingers: how much you consume, you pay so much. Over time, everything got better:
But trouble came from the other side. The site began to constantly fall with an error Unknown reason (eg unexpected eof, timeout) - thanks to the host tracker for such information.
There is another free website monitoring service, basicstate.com , which prompted me to the idea that in the case of this cloud hosting there is traffic overselling.
date_________uptime____dns_____connect__request____ttfb______ttlb
2011-02-22 ____ 97.94 ____ 0.114 ____ 0.265 ____ 0.265 ____ 1.352 ____ 1.731
2011-02-21 ____ 97.94 ____ 0.285 ____ 0.553 ____ 0.553 ____ 1.821 ____ 2.270
2011-02-20 ____ 97.94 ____ 0.219 ____ 0.373 ____ 0.373 ____ 1.913 ____ 2.214
2011-02-19 ____ 94.12 ____ 0.079 ____ 0.234 ____ 0.234 ____ 1.500 ____ 1.792
2011-02-18 ____ 97.94 ____ 0.169 ____ 0.320 ____ 0.320 ____ 0.732 ____ 1.033
Those. inside the cloud everything is fine, everything flies. But the channel leading to the cloud is not rubber, and it is stupidly clogged with traffic from customers. Look at the difference between TTFB (Time To First Byte) and TTLB (Time To Last Byte). Theoretically, everything is correct, data has a volume, but they cannot pass through the channel instantly. It turns out that they can:
date_________uptime____dns_____connect__request____ttfb______ttlb
2011-03-03 ___ 100.00 ____ 0.063 ____ 0.214 ____ 0.214 ____ 0.672 ____ 0.672
2011-03-02 ___ 100.00 ____ 0.010 ____ 0.161 ____ 0.161 ____ 0.624 ____ 0.624
2011-03-01 ___ 100.00 ____ 0.004 ____ 0.154 ____ 0.154 ____ 0.607 ____ 0.608
2011-02-28 ___ 100.00 ____ 0.008 ____ 0.158 ____ 0.159 ____ 0.637 ____ 0.638
2011-02-27 ___ 100.00 ____ 0.010 ____ 0.255 ____ 0.255 ____ 0.734 ____ 0.734
2011-02-26 ___ 100.00 ____ 0.007 ____ 0.157 ____ 0.157 ____ 0.622 ____ 0.622
2011-02-25 ___ 100.00 ____ 0.007 ____ 0.158 ____ 0.158 ____ 0.617 ____ 0.617
2011-02-24 ___ 100.00 ____ 0.006 ____ 0.187 ____ 0.187 ____ 0.743 ____ 0.870
2011-02-23 ___ 100.00 ____ 0.031 ____ 0.183 ____ 0.183 ____ 0.878 ____ 1.028
2011-02-22 ____ 97.94 ____ 0.114 ____ 0.265 ____ 0.265 ____ 1.352 ____ 1.731
2011-02-21 ____ 97.94 ____ 0.285 ____ 0.553 ____ 0.553 ____ 1.821 ____ 2.270
2011-02-20 ____ 97.94 ____ 0.219 ____ 0.373 ____ 0.373 ____ 1.913 ____ 2.214
2011-02-19 ____ 94.12 ____ 0.079 ____ 0.234 ____ 0.234 ____ 1.500 ____ 1.792
2011-02-18 ____ 97.94 ____ 0.169 ____ 0.320 ____ 0.320 ____ 0.732 ____ 1.033
Data from February 23 is another cloud hosting with a normal channel and a small number of clients. Actually, this should be VPS hosting.
Summing up the VPS selection criteria, it should be noted that everyone will have to try the hard way, sometimes changing hosting services like gloves, because there is no other way to look inside. So, after installing the site on a VPS, do the following:
1) We check the load via loadimpact.com Check should be done immediately by IP, before changing DNS, because we check hosting, and not the site itself. The schedule should be smooth under any load, time is less than a second. Additionally, we look at the top results online in order to understand how much our site consumes memory and processor to select the optimal VPS configuration.
2) If on the first point everything is fine, then we change the DNS. We are watching the results of the host-tracker and basicstate.com for a week and if everything is approximately like this:
uptime _____ dns ____connect__request ____ ttfb______ttlb
100.00 ____ 0.063 ____ 0.214 ____ 0.214 ____ 0.672 ____ 0.672
Then we go to drink beer. Everything.
Source: https://habr.com/ru/post/116217/
All Articles