[Translation] Heat maps: Customize gameplay with a simple system for collecting and analyzing game indicators
In this article , taken from the September 2010 issue of Game Developer’s Magazine, Chris Pruett, a Google-based game development consultant at Google, tells how he quickly and easily implemented a convenient system for evaluating gameplay in his game on the Android platform called Replica Island .
Nothing compares to the feeling that you experience, watching someone play the game you created. In the process of developing a game, you play every day, and develop, perhaps unconsciously, a certain style of play. But by putting your game in the hands of another person, you get the opportunity to see what happens to your creation, when it is used without one like yours, the daily playing experience.
Every problem that arises, a failure in animation, incomprehensible text in the manual and periodic errors, make a much stronger impression when a beginner plays a game. It doesn’t matter how long you have honed the gameplay and how many mistakes you fixed, your elaborated style of play and your particular involvement in the gameplay of the game you create can prevent you from clearly seeing the problems that other players can face right away.
That's why testing gameplay is a vital part of creating a good game. To get the most out of testing, we need to save information about the process of passing the game. This article describes my experience in solving this problem.
')
My first steps in the game I did, creating games for the Game Boy Advance. At that time, the testing approach was quite simple: we gave the neighboring guys a special Game Boy Advance device connected to the VCR, recorded their game, and then we looked at the recordings. This allowed us to catch obvious and major errors.
The parts of the game, the passage of which caused strong negative emotions among the children, were taken to additional elaboration. When a player fails time after time at a certain place in the game, this is a clear signal that this part of the gameplay needs to be reworked. Several game runs with the help of neighbors and we could significantly improve our games.
Currently, I am working as a consultant in the field of creating games for Google Android. My first game for this platform, arcade Replica Island, is not much different from Game Boy games that I wrote 10 years ago. But something has changed - I did not work more for the company that created the games, I wrote it for myself, with the help of one artist, mostly working in my free time.

Now I do not have access to the audience of young beta testers that was at that time. And even be this access, the current target audience for the game is somewhat older.
In the end, there is no easy way to collect information about the passing game on the phone. The only way is to stand “above the soul” during the game, but this is inconvenient and can affect how the player plays, which reduces the purity of the experiment.
What is an independent developer to do? Having completed the development of Replica Island, I realized that there is no guarantee that it will be interesting to play this game. The game was developed “in a vacuum” and I needed a side view of the gameplay before I could be sure that it was time to release the game.
The first thing I tried was the polls. I arranged the game on the internal server of the company where I worked, and sent letters to colleagues asking me to play and send me my impressions. I even opened a small forum with questions about the game. This approach did not work.
Despite the fact that many people downloaded the game, very few, less than one percent of those who downloaded it, bother to answer my questions. By the same, those who answered the questions did not give enough information. It is difficult to understand exactly what caused the assessment of "the game is difficult to play." Whether the cause was inconvenient control in the game, unsuccessful level design, location of obstacles in the game, guides to passing levels, or something else.
After that incident, I thought about the system of collecting and processing indicators for the gameplay, which was developed by Naughty Dog for the game Crash Bandicoot .
The system recorded statistics on the game process on a memory card. These data were then collected (offline) in order to find the difficult to pass sections, or areas where the game character most often died.
These problem areas were reworked, and this information was also used to dynamically adjust the complexity of the game.
One of the interesting principles that I was guided by when creating my system was the idea of Naughty Dog that you should avoid ending the game with all your might. Their ultimate goal was to eliminate the moments when the player was stuck at some stage and could not continue the game.
I liked this idea, but then I did not understand how feasible it was for playing on the phone. I asked a little from people around to understand the current situation with the recording of statistics for games with large budgets. And I learned that many companies use mechanisms for collecting information on the activity of players.
Several people said that despite the fact that they collect a large amount of information, they have difficulty in processing and presenting this data in a form that is easy to understand and understand what needs to be changed in the games studied.
On the other hand, some studios have tools that can recreate player level movements and generate statistics on which weapons players prefer, which opponents are harder to defeat, and which parts of the card are clearly visible in a particular case.
It seems that the formation of a set of indicators for the player is applicable for a wide class of games, but this is justified only for large companies that invest significant resources to build tools for processing the collected data.
An example of how this type of system can be most effectively used can be seen in the presentation by Georg Zoeller about the remarkable telemetry system they use in BioWare.
It turned out that the collection of data about the gameplay is the easy part of the task, but the interpretation of this data in such a way as to give a clear and useful picture to the creators of the game is much more difficult.
It sounded discouraging as I tried to keep my toolbox as simple as possible. But I decided to experiment all the same with some key indicators.
My Android phone did not have a memory card, but there was a permanent Internet connection. Perhaps, I thought, I could fix some important events in the game, send them to the server and get results from it. My goal was to understand as much as possible about how to play my game, while leaving the system as simple as possible.
The system I wrote consisted of three parts: the execution flow, which during the game process collects data about the player's actions and sends them to the server, the server itself, and a tool for processing the collected data.
The server is too loud, of course. My server was represented by 30 lines of a PHP script that checked a GET request over HTTP and recorded the results in a MySQL database. The structure of the GET request, in turn, was also very simple. These are event name, coordinates, code version, session ID, and timestamp.
These data, directly in the received form, were entered into the database. The current data processing was also performed in PHP, when a special page was opened on the server. Not a very good choice in the long term, this will be discussed below.
I started by registering two events: the death of the game character and the completion of the level. Each time a game character died, or the player completed the level, the game sent the corresponding event to the server. From this data, I was subsequently able to form a fairly detailed picture of the gameplay.
I was able to see which levels require the most time to pass, at which levels the player most often dies, and which of them passes too quickly. Having grouped these data by players, I saw what percentage of all players died at one level or another, and the average value of failures for each player.
Analyzing the coordinates of an event, I could tell in which cases the game character was killed by the actions of the enemy, and in which from falling into the pit. For a start, my simple scorecard was pretty well detailed.
As soon as my base system began to work, I released an update for beta testers and began to monitor the incoming data. Quite quickly, repetitive situations were identified.
At some levels, almost one hundred percent of the players failed at least once, while at other levels the players were stuck for several hours, which meant an unsuccessfully designed level, as it was supposed to be completed within a few minutes. Analyzing this data, I got a clear idea of what levels need improvement.
But the definition of problem levels was not sufficient. Sometimes I could not say why there was a problem at this or that particular level.
And I moved a step further. Using the same data, I wrote a tool to indicate the location of the death of a game character on a level map. And I was able to see exactly where the game character died, and where not.
The first run of the system showed only a small point at the level where the game character died. But with the increase in the number of players, I began to get something like heat maps (denoting heat maps) denoting the places of death of players on the level maps, which were much easier to perceive. The chapter dedicated to the creation of a heat map will be presented below.
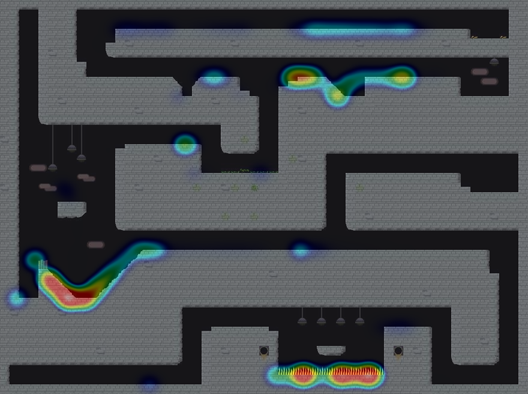
Heat map generated from data on the death of game characters in Replica Island
The combination of high-level game statistics and the designation at the levels of the places of death of game characters shed light on the flaws in the game design. I realized, for example, that a large number of players died when they met the very first monster. It was not because the monster was very strong. After a detailed study of the situation, I came to the conclusion that the monster appeared in a place where the main method of attack - a jump from above - was difficult to implement because of the low ceiling.
I also realized that my simple system for dynamically adjusting the complexity of the game itself required correction. This system, without advertising this fact, increased the life of the game character and the energy for his flight after a certain number of consecutive deaths. Studying statistics, I realized that she should have done this much earlier.
Also, the structure of my levels has undergone major changes. I had a sufficient number of levels with high time, which was spent on their passage, but with a small number of deaths. And I realized that the players simply got lost on the level. I redid these levels to make their order more clear. In a couple of cases, I even completely redid the levels from scratch.
But the biggest problem I ran into was the pits. Replica Island is a platformer, and, as you can guess, in it the player needs to do a large number of jumps over the pits. In contrast to the constantly rotating marsupials and plumbing dwellers , my game character had the main method of movement.
I needed a game character control system that would not require a gamepad. Since the main character of the game, the green Android robot used rocket engines on its legs to fly. The basic model of movement was to get an impulse even on the surface before the jump and, using this impulse, with the help of engines fly in the right direction. The engines consumed energy rather quickly, but the energy was renewed upon landing. And the idea was that the player would make a jump, and then, carefully spending energy, reach the right places, or make precise jumps on opponents, attacking them.
All this was good, but when I looked at the statistics of the death of game characters that came from beta testers, I found that they, for the most part, died in bottomless pits. Crowds of players fell through even the smallest pits. And more worried about the fact that over the course of the game the number of deaths in the pits did not decrease. Players did not improve their skills in overcoming obstacles during the game.
After that, I carefully studied the game design and level design and formed several theories. The main problem, in my understanding, was that the players did not see the holes when they were in a jump. In the end, during the jump there was no noticeable presence of a simple pit or a trap pit at the landing site. And since my levels are often very high, it is difficult to determine which pits led to underground levels, and which of them led to terrible death.
The second and more important problem was that the behavior of the camera, showing the main character of the game, was not well developed. When the main character made the high jump, the surface of the earth disappeared from view. As a result, it was difficult to determine the right place to land.
Famous platformers like Super Mario Bros almost never perform vertical scrolling. In Mario, there is a whole set of complex rules that determine when a camera can move up and down. However, in my game, the presence of flight mechanics meant that I allowed vertical scrolling in all cases. After a large number of corrections made, I got a more intelligent behavior of the camera, which does not start moving upwards, unless the player himself approached the border of the displayed area.
After all these changes, I released another update for my beta testers and compared the results with the results obtained from the previous version of the game. The changes were very promising. The total number of deaths has decreased, the time required to complete the levels has basically returned to normal. And the mortality from falling into the pits decreased markedly.
I repeated the testing process several times before I was ready to release the final version of the game. With my scorecard, it was easy to determine how certain changes affect the beta testers.
So, after several test runs, my graphs began to show the standard normal distribution , which I was aiming for. It's time to release the game and I decided to leave the system of collecting indicators built into the game. I wondered if the information that I would receive from new users would differ from the one I received from the group of beta testers. There was only one way to find out.
Of course, every time the game sends data to the server, the best solution would be to notify the user.
The first time after the release of the game in the welcome message, which is shown with information about the latest changes, was the information that the game sends anonymous and non-personalized information about the gameplay to the server to improve the game afterwards. And players who did not want this could turn off this system through the menu.
This approach seemed like the best solution. Despite the fact that the game code is open and anyone could study the structure of the data packets being sent (I was convinced beforehand that nothing could be matched to a specific person or device), I gave players the opportunity to say no, thank you.
Comparing the number of installations from the Android Market with the number of unique players in my scorecard, I came to the conclusion that less than 20% of game users refused to transfer data about the gameplay to the server.
As a logical result, I received a huge amount of data for analysis - more than 14 million information points, about a gigabyte of information about events that were generated by users of my game. At the time of this writing, their number was 1,200,000 players.
In fact, this amount of information broke my system pretty quickly. I have statistics collected from the first 13,000 players, which I published on the Replica Island game website. But after the release of the game, most of my analysis tools stopped working.
The good news was the fact that the first 13,000 players gave statistical information that was very similar to the smaller group of beta testers, which probably means that the results obtained in the test group can be applied to large groups. players.
I was very satisfied with my event reporting system in Replica Island. With little effort that cost me almost nothing (the server side that captures events cost me less than an Xbox Live account), and using only two types of events, I was able to quickly and efficiently determine the places in the game where players faced problems.
In addition, as soon as I began to collect this information, I was able to compare summary data from my system from different versions of my game, which gave me the opportunity to make sure that the changes I made to the game have a positive effect.
Using PHP and MySQL to implement the server side was a good decision. Event logging was so trivial that I’m sure it could just be implemented in any language. On PHP, the implementation of the entire server part took me less than half an hour.
Using a separate thread of execution to send events to the server was also a good move. I did not want the user interface to be blocked while sending HTTP requests, and brought the process of communication with the server into a separate execution thread.
At first I was afraid of slowing down the game on the device because of this, but as it turned out, there was no cause for concern. The additional load was so insignificant that I could not even notice it during the profiling of the game.
In the end, keeping the entire system as simple as possible was a good decision. I considered many different variations of events that I could register in my game. But tracking the moment of death of the main character of the game and the completion of the level provided more than enough information for analysis.
More information would complicate the data processing mechanisms, and it would probably make it harder to get a clear picture as a result. Now that I have some experience in creating an automatic system for collecting and processing indicators, I may decide to increase the amount of data I send to the server in the future. But starting with a simple system was definitely a good move, in my opinion.
Not everything in the event system worked well. I made several decisions that did not produce the expected results or were just a waste of time.
The decision to use PHP for the server side was a good move. However, it was a mistake to use PHP to process the received data. My idea was to do everything through the web interface. I even wrote my level editor in PHP and JavaScript.
But PHP began to slow down when the amount of data to be processed increased significantly. PHP worked in a very limited environment in terms of memory and computing resources. And I almost immediately ran into these restrictions. As soon as I began to receive information from 20,000 players, most of my PHP tools simply stopped working.
In particular, image processing in PHP was problematic. I implemented the entire heatmap generation mechanism in PHP, but I should have written something to run locally, instead of running on the server.
I ran into a large number of errors in the PHP GD interface (the formation of images with the alpha channel simply did not work), and decided to simply reduce the size of the level images for later processing.
For this article, I rewrote this tool using Python and ImageMagick .
And the results were impressive. The code for this implementation can be downloaded from the official Game Developer magazine website.
In the end, even though these data told me about when the game character died and how much time it took to complete the levels, they did not give me information in order to determine moments not related to the death of the main character of the game, when players quit playing my game (game shelf moments).
I concluded that I had released a game with some key gaps in the level design that my scorecard would never have found. In the most extreme situations, the players faced a task that they did not understand how to solve, and simply abandoned the game without completing the passing level.
This was never displayed on my system, since the condition for fixing a level completion event never occurred. I only learned about this when the players began to send me complaints that they were stuck in the same place as the game passed.
Although my automatic system was very convenient, it did not show me a complete picture of the gameplay. In my case, the indicators were good for identifying problem areas at levels, but would be ineffective in determining the miscalculations associated with the order of the interaction of game elements with each other.
For my next game, I will use a similar automatic system again. In addition to fixing the coordinates of the death of a game character, I may add events based on the form of the death that has overtaken him. It may be useful to know - exactly how the game character died, and not just to know exactly where it happened.
And, depending on the game, it may be useful to send to the server the history of movements of the game character before his death at one level or another.
However, the key point of such a system is its simplicity. Data collection does not make sense until you have created reliable tools for processing them.
For my next game I’ll rather leave untouched the basic system of sending data to the server and saving it to the database. And I will focus on creating the best tools for processing the data.
I am also interested in how the summary data obtained by the players can be used to set up dynamic systems for managing the complexity of the game.
If the game is able to receive aggregated data from the server, it will change its gameplay, based not only on the results of the game of one player, but also on the averaged data of millions of other players. In my opinion, this opens up new interesting opportunities.
The collection and analysis of player performance is not an ideal substitute for user testing. But they give a very useful averaged picture. And since the scorecard allows you to test the game on larger groups of players than is possible when working with individual beta testers, the system tells you more about the game in the long term.
The benefits derived from the scorecard more than offset the costs for it at Replica Island. Preserving the simplicity of the client and server parts, I received a lot of useful information about the design of the game levels and the habits of the players, and as a result, the game just got better.
The only thing I regret is that I did not implement such a system in my previous games. It seems that it is applicable in almost all games of any genre for all platforms.
The generation of heatmaps is not so difficult, but the search for exact instructions required some effort from me. I used a method similar to that described here .

When performing all these steps, make sure that you maintain the color space in the range of 8-bits per channel (in particular, when calculating the opacity in step 5). Or consider using a format that supports floating-point data for imaging.
You can easily identify precision errors (precision bugs), which will be noticeable with a large number of events, so that the contribution of one event to the overall picture will be less than one percent.
Tools like ImageMagick can help you solve this problem.
Nothing compares to the feeling that you experience, watching someone play the game you created. In the process of developing a game, you play every day, and develop, perhaps unconsciously, a certain style of play. But by putting your game in the hands of another person, you get the opportunity to see what happens to your creation, when it is used without one like yours, the daily playing experience.
Every problem that arises, a failure in animation, incomprehensible text in the manual and periodic errors, make a much stronger impression when a beginner plays a game. It doesn’t matter how long you have honed the gameplay and how many mistakes you fixed, your elaborated style of play and your particular involvement in the gameplay of the game you create can prevent you from clearly seeing the problems that other players can face right away.
That's why testing gameplay is a vital part of creating a good game. To get the most out of testing, we need to save information about the process of passing the game. This article describes my experience in solving this problem.
')
Starting small
My first steps in the game I did, creating games for the Game Boy Advance. At that time, the testing approach was quite simple: we gave the neighboring guys a special Game Boy Advance device connected to the VCR, recorded their game, and then we looked at the recordings. This allowed us to catch obvious and major errors.
The parts of the game, the passage of which caused strong negative emotions among the children, were taken to additional elaboration. When a player fails time after time at a certain place in the game, this is a clear signal that this part of the gameplay needs to be reworked. Several game runs with the help of neighbors and we could significantly improve our games.
Currently, I am working as a consultant in the field of creating games for Google Android. My first game for this platform, arcade Replica Island, is not much different from Game Boy games that I wrote 10 years ago. But something has changed - I did not work more for the company that created the games, I wrote it for myself, with the help of one artist, mostly working in my free time.
Now I do not have access to the audience of young beta testers that was at that time. And even be this access, the current target audience for the game is somewhat older.
In the end, there is no easy way to collect information about the passing game on the phone. The only way is to stand “above the soul” during the game, but this is inconvenient and can affect how the player plays, which reduces the purity of the experiment.
What is an independent developer to do? Having completed the development of Replica Island, I realized that there is no guarantee that it will be interesting to play this game. The game was developed “in a vacuum” and I needed a side view of the gameplay before I could be sure that it was time to release the game.
The first thing I tried was the polls. I arranged the game on the internal server of the company where I worked, and sent letters to colleagues asking me to play and send me my impressions. I even opened a small forum with questions about the game. This approach did not work.
Despite the fact that many people downloaded the game, very few, less than one percent of those who downloaded it, bother to answer my questions. By the same, those who answered the questions did not give enough information. It is difficult to understand exactly what caused the assessment of "the game is difficult to play." Whether the cause was inconvenient control in the game, unsuccessful level design, location of obstacles in the game, guides to passing levels, or something else.
Reflecting on the scorecard
After that incident, I thought about the system of collecting and processing indicators for the gameplay, which was developed by Naughty Dog for the game Crash Bandicoot .
The system recorded statistics on the game process on a memory card. These data were then collected (offline) in order to find the difficult to pass sections, or areas where the game character most often died.
These problem areas were reworked, and this information was also used to dynamically adjust the complexity of the game.
One of the interesting principles that I was guided by when creating my system was the idea of Naughty Dog that you should avoid ending the game with all your might. Their ultimate goal was to eliminate the moments when the player was stuck at some stage and could not continue the game.
I liked this idea, but then I did not understand how feasible it was for playing on the phone. I asked a little from people around to understand the current situation with the recording of statistics for games with large budgets. And I learned that many companies use mechanisms for collecting information on the activity of players.
Several people said that despite the fact that they collect a large amount of information, they have difficulty in processing and presenting this data in a form that is easy to understand and understand what needs to be changed in the games studied.
On the other hand, some studios have tools that can recreate player level movements and generate statistics on which weapons players prefer, which opponents are harder to defeat, and which parts of the card are clearly visible in a particular case.
It seems that the formation of a set of indicators for the player is applicable for a wide class of games, but this is justified only for large companies that invest significant resources to build tools for processing the collected data.
An example of how this type of system can be most effectively used can be seen in the presentation by Georg Zoeller about the remarkable telemetry system they use in BioWare.
It turned out that the collection of data about the gameplay is the easy part of the task, but the interpretation of this data in such a way as to give a clear and useful picture to the creators of the game is much more difficult.
It sounded discouraging as I tried to keep my toolbox as simple as possible. But I decided to experiment all the same with some key indicators.
My Android phone did not have a memory card, but there was a permanent Internet connection. Perhaps, I thought, I could fix some important events in the game, send them to the server and get results from it. My goal was to understand as much as possible about how to play my game, while leaving the system as simple as possible.
Basic system
The system I wrote consisted of three parts: the execution flow, which during the game process collects data about the player's actions and sends them to the server, the server itself, and a tool for processing the collected data.
The server is too loud, of course. My server was represented by 30 lines of a PHP script that checked a GET request over HTTP and recorded the results in a MySQL database. The structure of the GET request, in turn, was also very simple. These are event name, coordinates, code version, session ID, and timestamp.
These data, directly in the received form, were entered into the database. The current data processing was also performed in PHP, when a special page was opened on the server. Not a very good choice in the long term, this will be discussed below.
I started by registering two events: the death of the game character and the completion of the level. Each time a game character died, or the player completed the level, the game sent the corresponding event to the server. From this data, I was subsequently able to form a fairly detailed picture of the gameplay.
I was able to see which levels require the most time to pass, at which levels the player most often dies, and which of them passes too quickly. Having grouped these data by players, I saw what percentage of all players died at one level or another, and the average value of failures for each player.
Analyzing the coordinates of an event, I could tell in which cases the game character was killed by the actions of the enemy, and in which from falling into the pit. For a start, my simple scorecard was pretty well detailed.
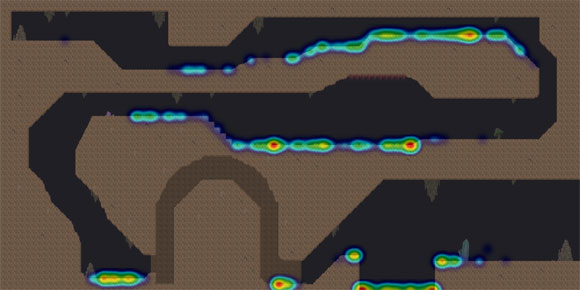
We note failures on the map in bright red
As soon as my base system began to work, I released an update for beta testers and began to monitor the incoming data. Quite quickly, repetitive situations were identified.
At some levels, almost one hundred percent of the players failed at least once, while at other levels the players were stuck for several hours, which meant an unsuccessfully designed level, as it was supposed to be completed within a few minutes. Analyzing this data, I got a clear idea of what levels need improvement.
But the definition of problem levels was not sufficient. Sometimes I could not say why there was a problem at this or that particular level.
And I moved a step further. Using the same data, I wrote a tool to indicate the location of the death of a game character on a level map. And I was able to see exactly where the game character died, and where not.
The first run of the system showed only a small point at the level where the game character died. But with the increase in the number of players, I began to get something like heat maps (denoting heat maps) denoting the places of death of players on the level maps, which were much easier to perceive. The chapter dedicated to the creation of a heat map will be presented below.
Heat map generated from data on the death of game characters in Replica Island
Visual aids on errors in the design of the game
The combination of high-level game statistics and the designation at the levels of the places of death of game characters shed light on the flaws in the game design. I realized, for example, that a large number of players died when they met the very first monster. It was not because the monster was very strong. After a detailed study of the situation, I came to the conclusion that the monster appeared in a place where the main method of attack - a jump from above - was difficult to implement because of the low ceiling.
I also realized that my simple system for dynamically adjusting the complexity of the game itself required correction. This system, without advertising this fact, increased the life of the game character and the energy for his flight after a certain number of consecutive deaths. Studying statistics, I realized that she should have done this much earlier.
Also, the structure of my levels has undergone major changes. I had a sufficient number of levels with high time, which was spent on their passage, but with a small number of deaths. And I realized that the players simply got lost on the level. I redid these levels to make their order more clear. In a couple of cases, I even completely redid the levels from scratch.
But the biggest problem I ran into was the pits. Replica Island is a platformer, and, as you can guess, in it the player needs to do a large number of jumps over the pits. In contrast to the constantly rotating marsupials and plumbing dwellers , my game character had the main method of movement.
I needed a game character control system that would not require a gamepad. Since the main character of the game, the green Android robot used rocket engines on its legs to fly. The basic model of movement was to get an impulse even on the surface before the jump and, using this impulse, with the help of engines fly in the right direction. The engines consumed energy rather quickly, but the energy was renewed upon landing. And the idea was that the player would make a jump, and then, carefully spending energy, reach the right places, or make precise jumps on opponents, attacking them.
All this was good, but when I looked at the statistics of the death of game characters that came from beta testers, I found that they, for the most part, died in bottomless pits. Crowds of players fell through even the smallest pits. And more worried about the fact that over the course of the game the number of deaths in the pits did not decrease. Players did not improve their skills in overcoming obstacles during the game.
After that, I carefully studied the game design and level design and formed several theories. The main problem, in my understanding, was that the players did not see the holes when they were in a jump. In the end, during the jump there was no noticeable presence of a simple pit or a trap pit at the landing site. And since my levels are often very high, it is difficult to determine which pits led to underground levels, and which of them led to terrible death.
The second and more important problem was that the behavior of the camera, showing the main character of the game, was not well developed. When the main character made the high jump, the surface of the earth disappeared from view. As a result, it was difficult to determine the right place to land.
Famous platformers like Super Mario Bros almost never perform vertical scrolling. In Mario, there is a whole set of complex rules that determine when a camera can move up and down. However, in my game, the presence of flight mechanics meant that I allowed vertical scrolling in all cases. After a large number of corrections made, I got a more intelligent behavior of the camera, which does not start moving upwards, unless the player himself approached the border of the displayed area.
After all these changes, I released another update for my beta testers and compared the results with the results obtained from the previous version of the game. The changes were very promising. The total number of deaths has decreased, the time required to complete the levels has basically returned to normal. And the mortality from falling into the pits decreased markedly.
I repeated the testing process several times before I was ready to release the final version of the game. With my scorecard, it was easy to determine how certain changes affect the beta testers.
Game release
So, after several test runs, my graphs began to show the standard normal distribution , which I was aiming for. It's time to release the game and I decided to leave the system of collecting indicators built into the game. I wondered if the information that I would receive from new users would differ from the one I received from the group of beta testers. There was only one way to find out.
Of course, every time the game sends data to the server, the best solution would be to notify the user.
The first time after the release of the game in the welcome message, which is shown with information about the latest changes, was the information that the game sends anonymous and non-personalized information about the gameplay to the server to improve the game afterwards. And players who did not want this could turn off this system through the menu.
This approach seemed like the best solution. Despite the fact that the game code is open and anyone could study the structure of the data packets being sent (I was convinced beforehand that nothing could be matched to a specific person or device), I gave players the opportunity to say no, thank you.
Comparing the number of installations from the Android Market with the number of unique players in my scorecard, I came to the conclusion that less than 20% of game users refused to transfer data about the gameplay to the server.
As a logical result, I received a huge amount of data for analysis - more than 14 million information points, about a gigabyte of information about events that were generated by users of my game. At the time of this writing, their number was 1,200,000 players.
In fact, this amount of information broke my system pretty quickly. I have statistics collected from the first 13,000 players, which I published on the Replica Island game website. But after the release of the game, most of my analysis tools stopped working.
The good news was the fact that the first 13,000 players gave statistical information that was very similar to the smaller group of beta testers, which probably means that the results obtained in the test group can be applied to large groups. players.
Anyway, this plan worked.
I was very satisfied with my event reporting system in Replica Island. With little effort that cost me almost nothing (the server side that captures events cost me less than an Xbox Live account), and using only two types of events, I was able to quickly and efficiently determine the places in the game where players faced problems.
In addition, as soon as I began to collect this information, I was able to compare summary data from my system from different versions of my game, which gave me the opportunity to make sure that the changes I made to the game have a positive effect.
Using PHP and MySQL to implement the server side was a good decision. Event logging was so trivial that I’m sure it could just be implemented in any language. On PHP, the implementation of the entire server part took me less than half an hour.
Using a separate thread of execution to send events to the server was also a good move. I did not want the user interface to be blocked while sending HTTP requests, and brought the process of communication with the server into a separate execution thread.
At first I was afraid of slowing down the game on the device because of this, but as it turned out, there was no cause for concern. The additional load was so insignificant that I could not even notice it during the profiling of the game.
In the end, keeping the entire system as simple as possible was a good decision. I considered many different variations of events that I could register in my game. But tracking the moment of death of the main character of the game and the completion of the level provided more than enough information for analysis.
More information would complicate the data processing mechanisms, and it would probably make it harder to get a clear picture as a result. Now that I have some experience in creating an automatic system for collecting and processing indicators, I may decide to increase the amount of data I send to the server in the future. But starting with a simple system was definitely a good move, in my opinion.
The cones that I filled
Not everything in the event system worked well. I made several decisions that did not produce the expected results or were just a waste of time.
The decision to use PHP for the server side was a good move. However, it was a mistake to use PHP to process the received data. My idea was to do everything through the web interface. I even wrote my level editor in PHP and JavaScript.
But PHP began to slow down when the amount of data to be processed increased significantly. PHP worked in a very limited environment in terms of memory and computing resources. And I almost immediately ran into these restrictions. As soon as I began to receive information from 20,000 players, most of my PHP tools simply stopped working.
In particular, image processing in PHP was problematic. I implemented the entire heatmap generation mechanism in PHP, but I should have written something to run locally, instead of running on the server.
I ran into a large number of errors in the PHP GD interface (the formation of images with the alpha channel simply did not work), and decided to simply reduce the size of the level images for later processing.
For this article, I rewrote this tool using Python and ImageMagick .
And the results were impressive. The code for this implementation can be downloaded from the official Game Developer magazine website.
In the end, even though these data told me about when the game character died and how much time it took to complete the levels, they did not give me information in order to determine moments not related to the death of the main character of the game, when players quit playing my game (game shelf moments).
I concluded that I had released a game with some key gaps in the level design that my scorecard would never have found. In the most extreme situations, the players faced a task that they did not understand how to solve, and simply abandoned the game without completing the passing level.
This was never displayed on my system, since the condition for fixing a level completion event never occurred. I only learned about this when the players began to send me complaints that they were stuck in the same place as the game passed.
Although my automatic system was very convenient, it did not show me a complete picture of the gameplay. In my case, the indicators were good for identifying problem areas at levels, but would be ineffective in determining the miscalculations associated with the order of the interaction of game elements with each other.
Future
For my next game, I will use a similar automatic system again. In addition to fixing the coordinates of the death of a game character, I may add events based on the form of the death that has overtaken him. It may be useful to know - exactly how the game character died, and not just to know exactly where it happened.
And, depending on the game, it may be useful to send to the server the history of movements of the game character before his death at one level or another.
However, the key point of such a system is its simplicity. Data collection does not make sense until you have created reliable tools for processing them.
For my next game I’ll rather leave untouched the basic system of sending data to the server and saving it to the database. And I will focus on creating the best tools for processing the data.
I am also interested in how the summary data obtained by the players can be used to set up dynamic systems for managing the complexity of the game.
If the game is able to receive aggregated data from the server, it will change its gameplay, based not only on the results of the game of one player, but also on the averaged data of millions of other players. In my opinion, this opens up new interesting opportunities.
The collection and analysis of player performance is not an ideal substitute for user testing. But they give a very useful averaged picture. And since the scorecard allows you to test the game on larger groups of players than is possible when working with individual beta testers, the system tells you more about the game in the long term.
The benefits derived from the scorecard more than offset the costs for it at Replica Island. Preserving the simplicity of the client and server parts, I received a lot of useful information about the design of the game levels and the habits of the players, and as a result, the game just got better.
The only thing I regret is that I did not implement such a system in my previous games. It seems that it is applicable in almost all games of any genre for all platforms.
How to generate heat maps
The generation of heatmaps is not so difficult, but the search for exact instructions required some effort from me. I used a method similar to that described here .
The main actions are as follows:
- We generate a circle image in grayscale, the color of which changes from black in the center to transparent at the edges along the radial gradient. This is an image to display the point at which the event occurred.
- We generate a rectangular image with a color gradient. Let the bottom of the image be white or red, or any color you choose as the designation of the hottest place on the heat map. The top of the image should be black with several colors in between. This image will be used as a “dictionary” for generating a graphical report on statistical data later.
- We generate the list of coordinates of past events.
- We calculate the maximum number of points of occurring events that are in close proximity to each other. This will be the maximum heat value for the heat map.
- For each unique location in the event list, draw a circle image along the event coordinates. We draw the image with the coefficient of opacity, calculated by the formula:
( )/( "") * 100%
Use the multiply transfer model (multiply transfer mode: src * dst) to mix the points of the drawn circles with each other.
We superimpose the resulting image on a transparent canvas.
When the process is completed, we get an image with a large number of dark spots with varying intensity of black. This is an intermediate image that will be processed in the next step. - Take the image obtained in the previous step and add color to it. We take the level of transparency (alpha) for each point and, on its basis, calculate the Y-coordinate in the “color dictionary” constructed in step 2 in order to calculate the color for the point being processed.
- Take the resulting image and impose it on top of the game level image. Event locations will be shown as colored areas, where increasing color intensity indicates areas where more events occurred.
When performing all these steps, make sure that you maintain the color space in the range of 8-bits per channel (in particular, when calculating the opacity in step 5). Or consider using a format that supports floating-point data for imaging.
You can easily identify precision errors (precision bugs), which will be noticeable with a large number of events, so that the contribution of one event to the overall picture will be less than one percent.
Tools like ImageMagick can help you solve this problem.
Source: https://habr.com/ru/post/115854/
All Articles