Redesign Google Analytics: not just beautiful pictures
Since the advent of Google Analytics, a complete redesign of the system has been carried out only once: in 2007. Since then, for 4 years, the Analytics interface has not undergone significant changes. Functions in the meantime became more and more, and gradually they became cramped within the usual interface.
Professional web analytics are “fighting” about the limitations of the system every day: the menu is not expanded without reloading the page, search traffic is scattered over reports with strange logic, it is impossible to find a profile by name if you have many Analytics accounts connected to your Google account. In short, the more often we worked with the system, the more we hoped for changes: and now, finally, our requests were heard. In the new beta version, Google completely changed the appearance of Analytics and added new reports and capabilities to the system. I must say: the new version has caused me delight! It is possible to discuss and explore innovations for a very long time, so in the first review we will focus only on the most important ones.

The entire system of sections and menus in the new version is heavily rebuilt. A top tab bar appeared, dividing the Dashboard, all reports on the site (My Site section) and personalized reports. Clicking on the house icon returns us to the list of all accounts and profiles in our account.
')
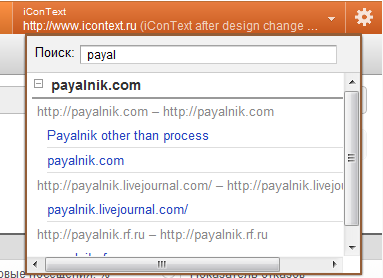
The drop-down list of profiles, located in the upper right corner of the screen, has become much nicer and friendlier. It has a search field that searches by both account names and profiles (conveniently, if you or your client have data from several Analytics accounts in one Analytics account).
If you select a new profile using this list, you will be taken to the same report as before: it is convenient to compare indicators of different profiles without having to re-navigate.
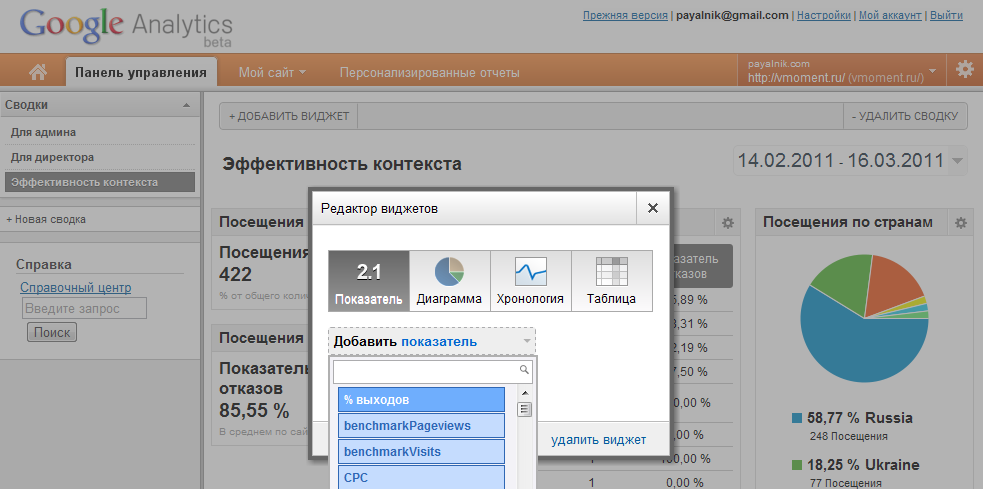
By the way, now you can make several Dashboard panels and put your own set of widgets on each:
There is another tab level in the “My Site” section: you can switch to Intelligence reports. The menu of standard reports, although it retained the overall structure of the sections, has become easier to use and more logical. Now you can get to any point without reloading the pages - the menu opens immediately.
Important changes have occurred in the structure of the sub-item "Traffic Sources". The composition of this section has become much more logical, now each item corresponds to traffic from a specific channel.
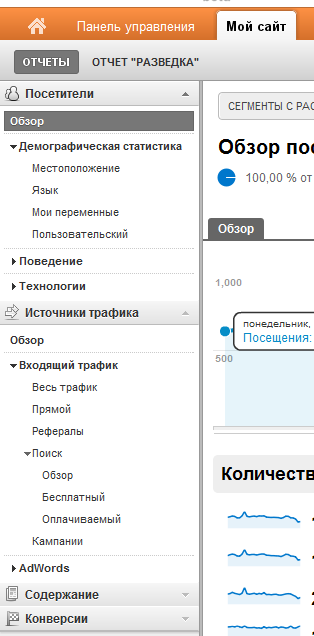
Now there are separate items for free search traffic (organic channel) and paid context (cpc channel): previously, the data from these reports were very often confused due to the non-intuitive menu structure.
You can select the slice for which you want to see the report within the report itself:
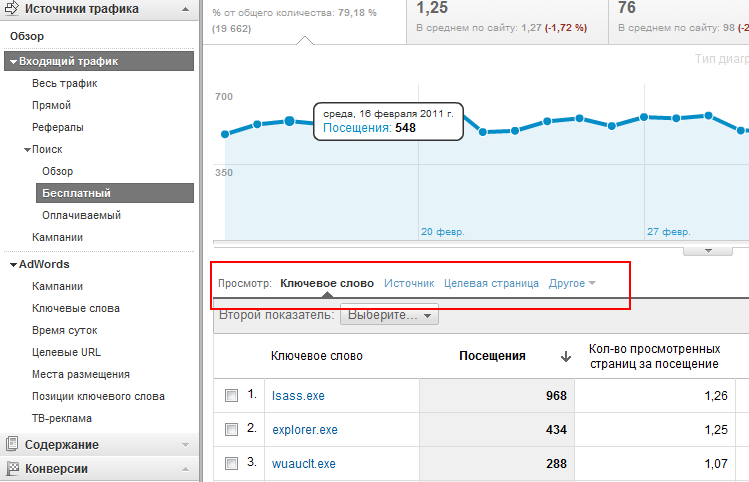
Awfully useful new feature - now you can mark several lines in the results table and plot data for each of them:

This is extremely convenient, for example, if you are researching changes in indicators and want to determine the effect of each source separately. It is also possible to simultaneously display any two indicators on the chart: it is much more convenient to analyze quality indicators (previously, the set of indicators depended on which report you were in).
A new data view has appeared: a tag cloud, in which the font size depends on the indicator you choose:
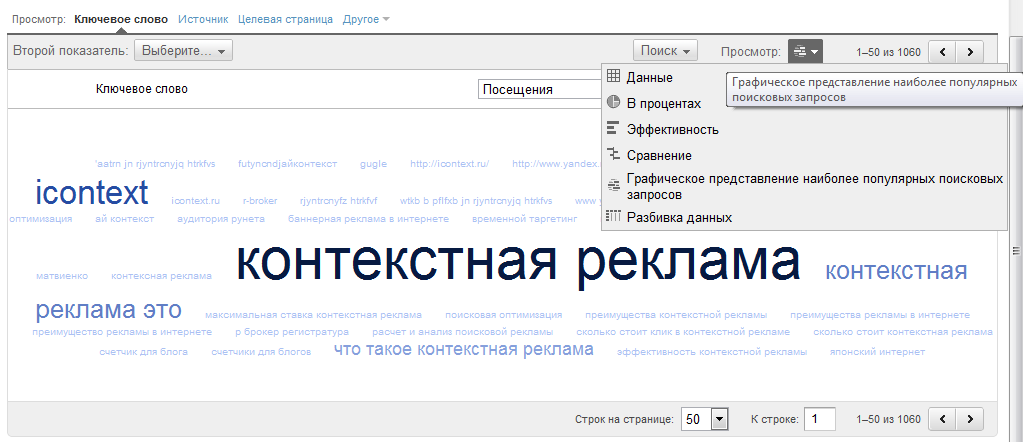
Avinash Koshik likes such clouds very much. However, in the Analytics version, the cloud is built not by words, but by specific queries.
Unfortunately, the new version of Analytics removed the $ Index index for pages of the site, which is useful when analyzing the effectiveness of pages. There are other changes: for example, there can now be 20 steps in the funnel for the goal (for the rest, the settings for the goals, filters and access remained essentially the same, although the interface has changed completely). Otherwise, sampling works (limiting the sample for large amounts of data). Most likely, we have yet to discover something new.
The new version of Analytics will gradually roll out for users in the form of an open beta version. The Russian version is available immediately (although problems with the glossary, characteristic for Analytics, unfortunately, still exist). Surely Google is working on new reports and features that will eventually find their place in the new interface. Will wait! Thanks, google!
PS: Do you remember what Analytics looked like in 2005 ?
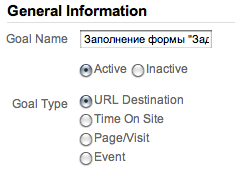
PPS: I missed a very important addition: now an event can be a goal! Also very important and expected innovation.
Professional web analytics are “fighting” about the limitations of the system every day: the menu is not expanded without reloading the page, search traffic is scattered over reports with strange logic, it is impossible to find a profile by name if you have many Analytics accounts connected to your Google account. In short, the more often we worked with the system, the more we hoped for changes: and now, finally, our requests were heard. In the new beta version, Google completely changed the appearance of Analytics and added new reports and capabilities to the system. I must say: the new version has caused me delight! It is possible to discuss and explore innovations for a very long time, so in the first review we will focus only on the most important ones.
The entire system of sections and menus in the new version is heavily rebuilt. A top tab bar appeared, dividing the Dashboard, all reports on the site (My Site section) and personalized reports. Clicking on the house icon returns us to the list of all accounts and profiles in our account.
')
The drop-down list of profiles, located in the upper right corner of the screen, has become much nicer and friendlier. It has a search field that searches by both account names and profiles (conveniently, if you or your client have data from several Analytics accounts in one Analytics account).
If you select a new profile using this list, you will be taken to the same report as before: it is convenient to compare indicators of different profiles without having to re-navigate.
By the way, now you can make several Dashboard panels and put your own set of widgets on each:
There is another tab level in the “My Site” section: you can switch to Intelligence reports. The menu of standard reports, although it retained the overall structure of the sections, has become easier to use and more logical. Now you can get to any point without reloading the pages - the menu opens immediately.
Important changes have occurred in the structure of the sub-item "Traffic Sources". The composition of this section has become much more logical, now each item corresponds to traffic from a specific channel.
Now there are separate items for free search traffic (organic channel) and paid context (cpc channel): previously, the data from these reports were very often confused due to the non-intuitive menu structure.
You can select the slice for which you want to see the report within the report itself:
Awfully useful new feature - now you can mark several lines in the results table and plot data for each of them:
This is extremely convenient, for example, if you are researching changes in indicators and want to determine the effect of each source separately. It is also possible to simultaneously display any two indicators on the chart: it is much more convenient to analyze quality indicators (previously, the set of indicators depended on which report you were in).
A new data view has appeared: a tag cloud, in which the font size depends on the indicator you choose:
Avinash Koshik likes such clouds very much. However, in the Analytics version, the cloud is built not by words, but by specific queries.
Unfortunately, the new version of Analytics removed the $ Index index for pages of the site, which is useful when analyzing the effectiveness of pages. There are other changes: for example, there can now be 20 steps in the funnel for the goal (for the rest, the settings for the goals, filters and access remained essentially the same, although the interface has changed completely). Otherwise, sampling works (limiting the sample for large amounts of data). Most likely, we have yet to discover something new.
The new version of Analytics will gradually roll out for users in the form of an open beta version. The Russian version is available immediately (although problems with the glossary, characteristic for Analytics, unfortunately, still exist). Surely Google is working on new reports and features that will eventually find their place in the new interface. Will wait! Thanks, google!
PS: Do you remember what Analytics looked like in 2005 ?
PPS: I missed a very important addition: now an event can be a goal! Also very important and expected innovation.
Source: https://habr.com/ru/post/115672/
All Articles