Statistics appeared on the Android Market
Hello.
Today I discovered that the market has its own statistics for each application.
Statistics show a graph of growth in the number of active installations of your application. Enough nice and convenient interface allows you to scale the chart by dragging the sliders at the bottom of the image.
')

Also interesting are graphs of statistics of the distribution of OS versions that use the application and the specific devices on which it runs.
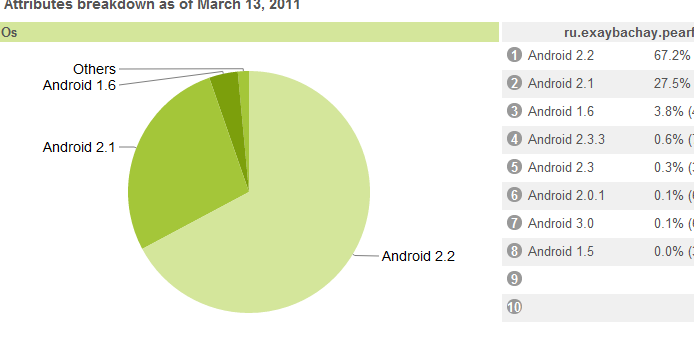

In addition, statistics are provided on the distribution of countries of use and languages, which can help to understand who to focus on in further development.
In general, summing up, we can say that nothing new has appeared in principle, such statistics have long been on AndroLib or AppBrain in one form or another, but much nicer when all this can be seen in one place.
IMHO, Google Analytics will not replace this, of course, but it will help you to specify certain directions.
Thank.
Today I discovered that the market has its own statistics for each application.
Statistics show a graph of growth in the number of active installations of your application. Enough nice and convenient interface allows you to scale the chart by dragging the sliders at the bottom of the image.
')
Also interesting are graphs of statistics of the distribution of OS versions that use the application and the specific devices on which it runs.
In addition, statistics are provided on the distribution of countries of use and languages, which can help to understand who to focus on in further development.
In general, summing up, we can say that nothing new has appeared in principle, such statistics have long been on AndroLib or AppBrain in one form or another, but much nicer when all this can be seen in one place.
IMHO, Google Analytics will not replace this, of course, but it will help you to specify certain directions.
Thank.
Source: https://habr.com/ru/post/115464/
All Articles