A hybrid way to display data on google maps
This article describes how to display data on interactive maps (maps.google.com, maps.yandex.ru).
In the posts of highly respected Kashey , the method of displaying objects on maps was discussed here and here .
Having studied this method, I started its implementation for the largest automotive resource.
In November, when most of the code was written, an unexpected thing happened - Google launched a map service, in which pictures (tiles) of maps with search results were formed on the fly.
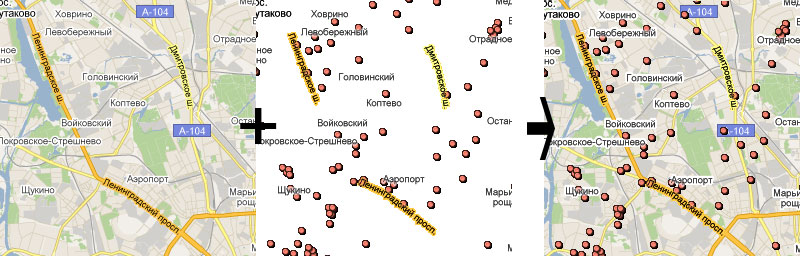
I called this technology “acne technology” - search results are displayed with small red dots applied directly to the png-image, which is a separate layer on top of the map layer. You can see here .
Displaying data as a separate layer has long been used, for example, on wikimapia.org. The main breakthrough of Google was that images with "acne" are formed "on the fly" and are not cached on the server. This requires large server costs.
I conducted my tests, and found out that the modern server draws up to 160 tiles per second. Comparing the load, it became clear that one server can serve no more than a hundred of simultaneously connected users, which is extremely small. Moreover, the technology also has several significant drawbacks:
At the same time there is an important plus - the ability to display a large number of objects without "clustering" and the load on the client and the browser's DOM.
By the way, in the newly launched realty.yandex.ru maps are made just on the DOM (that is, each marker is a DIV). Therefore it turns out like this
Walk around the map ...
As a result of subsequent surveys, the so-called "Hybrid" system.
')
The essence of the “hybrid” is that, depending on the capabilities of the browser (of course, we are talking about ie), its own way of displaying data is used.
For example, all modern browsers (except ie up to version 9) support the canvas tag.
For these browsers, I applied the technology of drawing a layer with objects directly on the client.
Thus, when moving / zooming a card, only 1 server request occurs. After receiving the data, the browser itself draws a layer.
The second way to display - for ie8 and some other browsers - uses dataUrl. Again for each movement - 1 request. Pictures are drawn on the server and sent with the data in one xml file.
To date, such requests - about 18%. it is clear that gradually the percentage will decrease.
The third way is classic. First, data is transmitted, and then images are requested - for each image, your request. This is for ie 7 and below. There are about 6%. This method is used in Google Maps.
In total, using such a hybrid, we received a decrease in the number of requests compared to the “classics” by 4 times, the load on the server — also almost 4 times.
Now on my maps, a maximum of 100 objects per tile are displayed. With an average window size, this is up to 2400 "acne."
Separately, the problem with data retrieval was solved.
If everything were simple and it was necessary to display only data for several previously known categories, there would be no point in making a garden. But the problem was that the output was on the keywords in the search box. Of course, for this hooked up sphinx.
But the problem was different:
Every time you move the map, you need to re-form the request, run it through the parser and sphinx, then get the dots through mysql ... You need to simplify it somehow ...
As a result, a php caching engine was created using memcache.
Everything happens as follows:
The server receives a search string (for example, “Audi dealers”), parses it and sends it to sphinx. Sphinx gives the search result, then a mysql request for getting points is formed and executed. All received points are packed and sent to memekash.
So, for 10,000 points found, the cache size is about 1mb. As planned - this is the maximum size.
Further, when the map requests for points, data is loaded from memcache and very quickly searched.
Very quickly - this is up to 0.02 seconds at 10,000 points. In the caching class, only native php functions are used for the samples, no cycles with enumeration of values, etc.
Cash lives no more than 3 minutes. If the cache does not contain the necessary data, the request is again formed, executed and cached. To do this, a search string is duplicated in the request for the tile and data for the map.
In general, the cache class provides the possibility of caching in various ways, including disk caching. For the case when you need to use not a search box, but a menu with categories, various lists and daws. If the number of types of requests will be finite, this method will do.
The server-class managing the cards accepts a sprite with markers and their descriptions upon initialization.
Description is the size, position in sprite, anchor, shadow, etc.
Accordingly, in the sprite you can fill a very large number of markers and use them all on the map. The size of the marker for my system is up to 200x200, which is more than enough.
When transferring data to the engine, for each point you can set your own marker (from sprite) with a shadow and hover. And it will be displayed (in one of 3 ways).
It was decided to use 3 levels of maps - country, region, city. At the “country” level we show markers of regional capitals, at the level of “region” - cities, “city” - points (“acne”).
The number of levels is governed by the settings.
But what about Yandex?
In the written engine with small conversions, you can build in support for Yandex cards.
But such a task was not set, therefore it was not implemented.
To date, the project has been written at 80%, but the main ideas have already been implemented.
You can see here russia.auto.ru
and here club-lexus.ru/partners/index.php?city=1&mode=citymap
In the posts of highly respected Kashey , the method of displaying objects on maps was discussed here and here .
Having studied this method, I started its implementation for the largest automotive resource.
In November, when most of the code was written, an unexpected thing happened - Google launched a map service, in which pictures (tiles) of maps with search results were formed on the fly.
I called this technology “acne technology” - search results are displayed with small red dots applied directly to the png-image, which is a separate layer on top of the map layer. You can see here .
Displaying data as a separate layer has long been used, for example, on wikimapia.org. The main breakthrough of Google was that images with "acne" are formed "on the fly" and are not cached on the server. This requires large server costs.
I conducted my tests, and found out that the modern server draws up to 160 tiles per second. Comparing the load, it became clear that one server can serve no more than a hundred of simultaneously connected users, which is extremely small. Moreover, the technology also has several significant drawbacks:
- a large number of server requests (for each tile)
- the need to select objects for display for each request for a tile
At the same time there is an important plus - the ability to display a large number of objects without "clustering" and the load on the client and the browser's DOM.
By the way, in the newly launched realty.yandex.ru maps are made just on the DOM (that is, each marker is a DIV). Therefore it turns out like this
Walk around the map ...
As a result of subsequent surveys, the so-called "Hybrid" system.
')
The essence of the “hybrid” is that, depending on the capabilities of the browser (of course, we are talking about ie), its own way of displaying data is used.
For example, all modern browsers (except ie up to version 9) support the canvas tag.
For these browsers, I applied the technology of drawing a layer with objects directly on the client.
Thus, when moving / zooming a card, only 1 server request occurs. After receiving the data, the browser itself draws a layer.
The second way to display - for ie8 and some other browsers - uses dataUrl. Again for each movement - 1 request. Pictures are drawn on the server and sent with the data in one xml file.
To date, such requests - about 18%. it is clear that gradually the percentage will decrease.
The third way is classic. First, data is transmitted, and then images are requested - for each image, your request. This is for ie 7 and below. There are about 6%. This method is used in Google Maps.
In total, using such a hybrid, we received a decrease in the number of requests compared to the “classics” by 4 times, the load on the server — also almost 4 times.
Now on my maps, a maximum of 100 objects per tile are displayed. With an average window size, this is up to 2400 "acne."
Sampling and caching
Separately, the problem with data retrieval was solved.
If everything were simple and it was necessary to display only data for several previously known categories, there would be no point in making a garden. But the problem was that the output was on the keywords in the search box. Of course, for this hooked up sphinx.
But the problem was different:
Every time you move the map, you need to re-form the request, run it through the parser and sphinx, then get the dots through mysql ... You need to simplify it somehow ...
As a result, a php caching engine was created using memcache.
Everything happens as follows:
The server receives a search string (for example, “Audi dealers”), parses it and sends it to sphinx. Sphinx gives the search result, then a mysql request for getting points is formed and executed. All received points are packed and sent to memekash.
So, for 10,000 points found, the cache size is about 1mb. As planned - this is the maximum size.
Further, when the map requests for points, data is loaded from memcache and very quickly searched.
Very quickly - this is up to 0.02 seconds at 10,000 points. In the caching class, only native php functions are used for the samples, no cycles with enumeration of values, etc.
Cash lives no more than 3 minutes. If the cache does not contain the necessary data, the request is again formed, executed and cached. To do this, a search string is duplicated in the request for the tile and data for the map.
In general, the cache class provides the possibility of caching in various ways, including disk caching. For the case when you need to use not a search box, but a menu with categories, various lists and daws. If the number of types of requests will be finite, this method will do.
Markers
The server-class managing the cards accepts a sprite with markers and their descriptions upon initialization.
Description is the size, position in sprite, anchor, shadow, etc.
Accordingly, in the sprite you can fill a very large number of markers and use them all on the map. The size of the marker for my system is up to 200x200, which is more than enough.
When transferring data to the engine, for each point you can set your own marker (from sprite) with a shadow and hover. And it will be displayed (in one of 3 ways).
Map levels
It was decided to use 3 levels of maps - country, region, city. At the “country” level we show markers of regional capitals, at the level of “region” - cities, “city” - points (“acne”).
The number of levels is governed by the settings.
But what about Yandex?
In the written engine with small conversions, you can build in support for Yandex cards.
But such a task was not set, therefore it was not implemented.
To date, the project has been written at 80%, but the main ideas have already been implemented.
You can see here russia.auto.ru
and here club-lexus.ru/partners/index.php?city=1&mode=citymap
Source: https://habr.com/ru/post/115198/
All Articles