PotokFM - search media in the archives of the regional radio
Colleagues, good afternoon.
In the last series, I introduced you to the PotokFM hardware and software complex that I built to work with FM radio broadcasting archives in the regions. Its basic service is the monitoring of the actual situation on the air with an automatic signaling device for discrepancies, illegal overlaps or silence on the air.
Among other things, the complex has search capabilities. In particular, according to the sound pattern, it gives out statistics of its rotations on the radio with high precision of entry. This service, Media Search (PM), is used to confirm the release of online advertising campaigns or to generate statistics of rotation of musical compositions for rightholders.
')
Recently, analyzing analytics for a couple of quarters, I came across an interesting graphical analysis of one advertising campaign, which I post. If there are pros on media planning, or in principle, specialists in advertising, share an expert assessment, it is too "funny" picture emerges.
Last fall, one of the manufacturers of automotive rubber launched a network advertising campaign on a very popular radio station with a large coverage of cities broadcast. I do not remember how this video appeared in the “Search” - there was no commercial order for it. Most likely one of the numerous experiments, the results of which were the statistics of the output of this ad in 25 cities of the country.
Summary table of results immediately caught my attention.
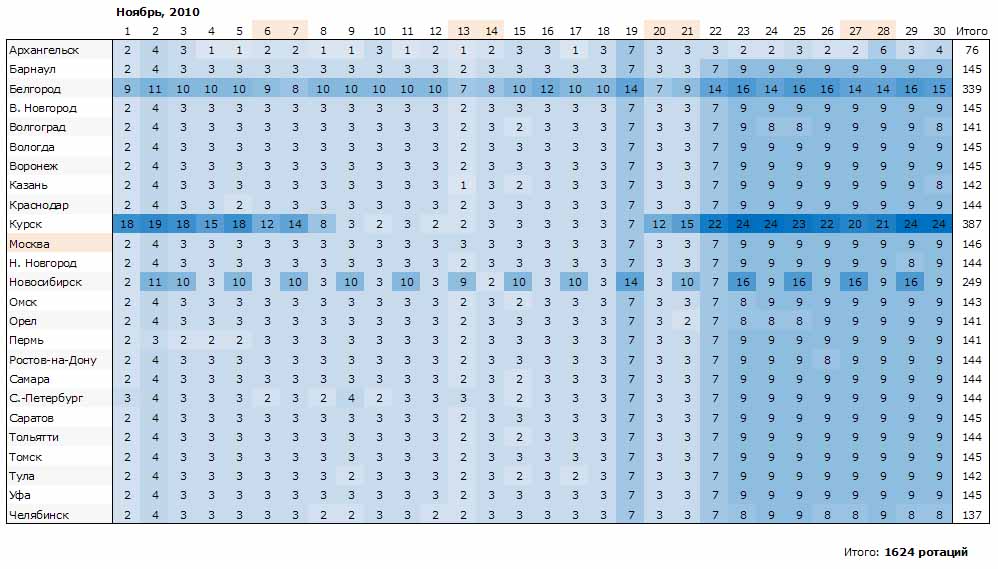
As far as I know, the network commercial should be heard in all cities broadcast channel. But I do not know how “criminal” is the absenteeism of one or two commercials. And ten?
By the way, for the month this campaign was not counted a couple of dozen rotations.
Also in the table you can note the activation of the campaign, which began on Friday (February 19) with a rollback for the weekend. Pros, perhaps, can explain why starting a new round on Friday, for me it is illogical.
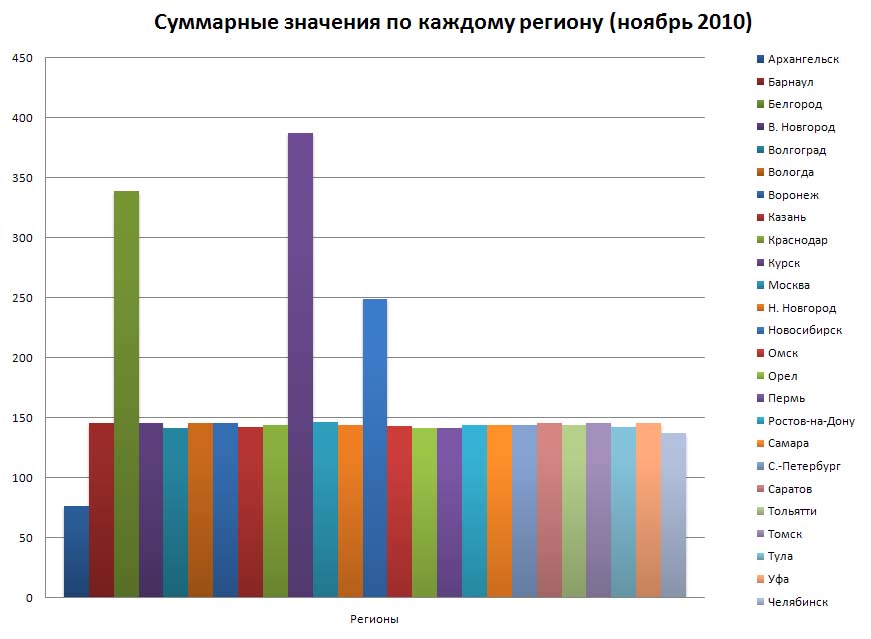
But this is not the most "delicious." Pay attention to the dynamics and totals.
When displaying a chart of the total values, all peaks are clearly visible. We will assume that strengthening media pressure in some regions and weakening in others are planned and coordinated actions to optimize the budget, which the glider approved with the customer.
But as you may have guessed from the pivot table, the most “tasty” is the daily dynamics, which in this case is a good example of the diversity of advertising strategies depending on the region.
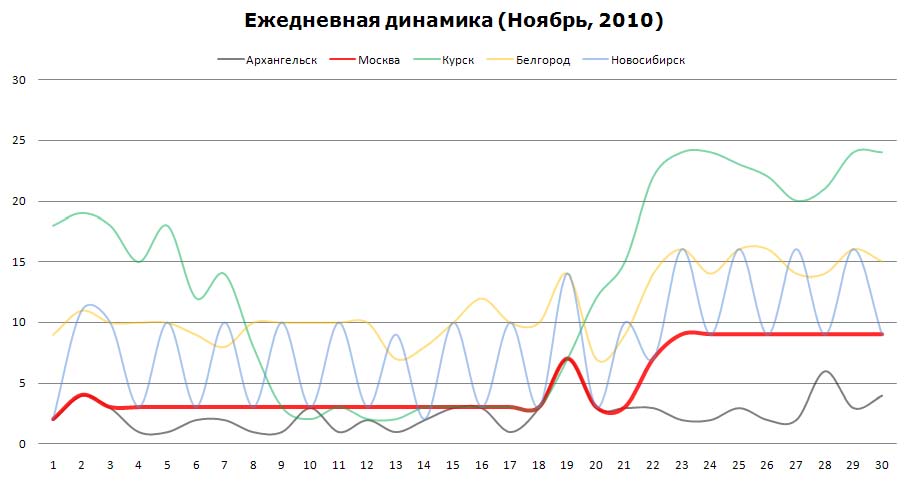
The line of Moscow values passes by a red thread, we will consider them as reference ones. It is evident that Moscow “sounds” smoothly, there is no decline for the weekend. Activation of the campaign three times begins on February 19 and continues at the same level until the end of the reporting period, thereby rolling back to the weekend. Everything is logical here, December is the most correct month for the population to change tires.
Arkhangelsk worked to the floor force (50% of the reference value). If you think about it, then in November, all the inhabitants of Pomerania, who wanted to, have already “pereobulyus”.
Belgorod - the number of rotations is 2-3 times more, but the trend of Moscow is repeated. But there is an exception. In contrast to the capital, in Belgorod there is a widespread decline in activity at the weekend throughout the month.
Kursk "went to success" in its own way. The reporting period of analysis captured the end of the previous wave and the beginning of a new one. Interestingly, the amplitude of wave dynamics exceeds the standard by 3-5 times. Does such activity say that Kursk people do not persistently buy tires from a customer-manufacturer?
Novosibirsk is the strangest picture. Dotted dynamics alternate the reference values of the rotation with the city of Belogorod. For what purpose such a model is chosen and how effective is it, remains a mystery to me.
Instead of the results, I’ll share the observation of the regional media space.
- The absolute majority of online advertising campaigns do not go 100%, losing up to a quarter of rotations (maybe I haven't met more).
“The analyzed example is beautiful in diversity, but very often a couple of twenty-thirty cities have a rotation schedule that is fundamentally different from all the others.
- Music over 4.5 minutes on the radio does not sound. On average, the song "cut" to 2.40.
- After the local tie-ins, the channel often has to “catch up” with something in order to extend the local broadcasting and coincide with the federal one. Such voids with a length of 20-40 seconds sometimes fill with music, often top performers. The question of how legal it is and how right holders relate to this is outside the scope of this article.
Thank you for attention. In the comments ready to answer questions.
In the last series, I introduced you to the PotokFM hardware and software complex that I built to work with FM radio broadcasting archives in the regions. Its basic service is the monitoring of the actual situation on the air with an automatic signaling device for discrepancies, illegal overlaps or silence on the air.
Among other things, the complex has search capabilities. In particular, according to the sound pattern, it gives out statistics of its rotations on the radio with high precision of entry. This service, Media Search (PM), is used to confirm the release of online advertising campaigns or to generate statistics of rotation of musical compositions for rightholders.
')
Recently, analyzing analytics for a couple of quarters, I came across an interesting graphical analysis of one advertising campaign, which I post. If there are pros on media planning, or in principle, specialists in advertising, share an expert assessment, it is too "funny" picture emerges.
Last fall, one of the manufacturers of automotive rubber launched a network advertising campaign on a very popular radio station with a large coverage of cities broadcast. I do not remember how this video appeared in the “Search” - there was no commercial order for it. Most likely one of the numerous experiments, the results of which were the statistics of the output of this ad in 25 cities of the country.
Summary table of results immediately caught my attention.
As far as I know, the network commercial should be heard in all cities broadcast channel. But I do not know how “criminal” is the absenteeism of one or two commercials. And ten?
By the way, for the month this campaign was not counted a couple of dozen rotations.
Also in the table you can note the activation of the campaign, which began on Friday (February 19) with a rollback for the weekend. Pros, perhaps, can explain why starting a new round on Friday, for me it is illogical.
But this is not the most "delicious." Pay attention to the dynamics and totals.
When displaying a chart of the total values, all peaks are clearly visible. We will assume that strengthening media pressure in some regions and weakening in others are planned and coordinated actions to optimize the budget, which the glider approved with the customer.
But as you may have guessed from the pivot table, the most “tasty” is the daily dynamics, which in this case is a good example of the diversity of advertising strategies depending on the region.
The line of Moscow values passes by a red thread, we will consider them as reference ones. It is evident that Moscow “sounds” smoothly, there is no decline for the weekend. Activation of the campaign three times begins on February 19 and continues at the same level until the end of the reporting period, thereby rolling back to the weekend. Everything is logical here, December is the most correct month for the population to change tires.
Arkhangelsk worked to the floor force (50% of the reference value). If you think about it, then in November, all the inhabitants of Pomerania, who wanted to, have already “pereobulyus”.
Belgorod - the number of rotations is 2-3 times more, but the trend of Moscow is repeated. But there is an exception. In contrast to the capital, in Belgorod there is a widespread decline in activity at the weekend throughout the month.
Kursk "went to success" in its own way. The reporting period of analysis captured the end of the previous wave and the beginning of a new one. Interestingly, the amplitude of wave dynamics exceeds the standard by 3-5 times. Does such activity say that Kursk people do not persistently buy tires from a customer-manufacturer?
Novosibirsk is the strangest picture. Dotted dynamics alternate the reference values of the rotation with the city of Belogorod. For what purpose such a model is chosen and how effective is it, remains a mystery to me.
Results
Instead of the results, I’ll share the observation of the regional media space.
- The absolute majority of online advertising campaigns do not go 100%, losing up to a quarter of rotations (maybe I haven't met more).
“The analyzed example is beautiful in diversity, but very often a couple of twenty-thirty cities have a rotation schedule that is fundamentally different from all the others.
- Music over 4.5 minutes on the radio does not sound. On average, the song "cut" to 2.40.
- After the local tie-ins, the channel often has to “catch up” with something in order to extend the local broadcasting and coincide with the federal one. Such voids with a length of 20-40 seconds sometimes fill with music, often top performers. The question of how legal it is and how right holders relate to this is outside the scope of this article.
Thank you for attention. In the comments ready to answer questions.
Source: https://habr.com/ru/post/114879/
All Articles