New version of Developer Tools
The beta channel has a new version of developer tools with very nice changes.
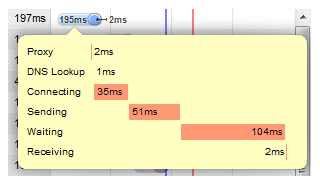
Network tab
- Information about the phases of each request appeared: how much time was spent on the proxy, DNS, waiting, sending and receiving data
- HTTP headers are now taken directly from the response body, before they were interpreted by the webcam, so you can see exactly what the server sent
') - Added syntax highlighting in response body
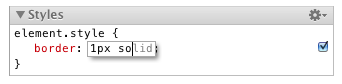
CSS tab
- The name and value of the field can now be edited separately, as in Firebug. There is auto-complete keywords
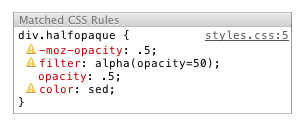
- All CSS properties are shown, even those that are targeted to other browsers or contain errors
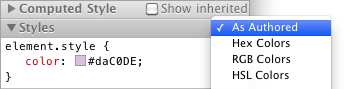
- You can choose in what format to show colors: how they were set in styles, Hex, RGB, or HSL
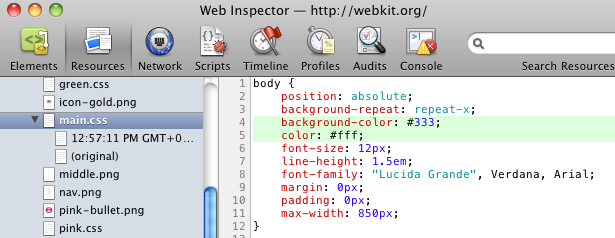
In the Resources tab
- The text of the CSS files now reflects the changes made when editing the corresponding styles in the Elements tab. Thus, it has become significantly easier to make these changes to the source files. As you edit, the complete change history is tracked. You can choose any revision, and see what has changed relative to the original. There is even a backlight change, which for some reason does not work for me. The revision can be taken with the mouse and dragged into a text editor.
Another couple of interesting things (which were before)
- In the Resources tab, you can edit the JS files (for HTML and CSS for some reason does not work)
- You can copy a variable from the console to the clipboard using copy (varName)
- You can go to the desired DOM element by invoking the console inspect (elementReference)
- The variable $ 0 in the console always contains the current element, which is picked out in the Elements tab.
Source: https://habr.com/ru/post/114494/
All Articles