TOP'i here
Overview of almost all * top utilities under linux (atop, iotop, htop, foobartop, etc.).
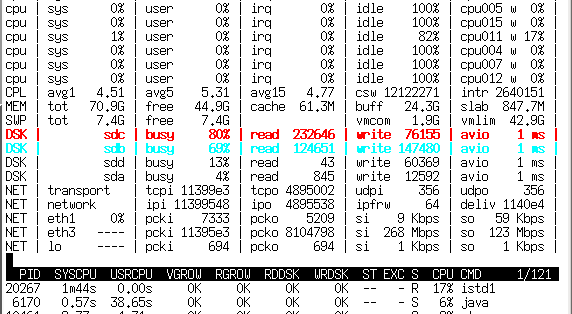
Atop has two modes of operation - collecting statistics and monitoring the system in real time. In the statistics collection mode, atop runs as a daemon and once every N time (usually 10 minutes) throws the state into a binary log. Then on this journal atop'om (key -r and the name of the log file) you can run back and forth with the T and t buttons, watching atop'a readings with averaging over 10 minutes at any interesting point in time.
')
Unlike top, he is well aware of the existence of block devices and a network interface, and is capable of showing their loading in percent (10G doesn’t work, however, percent does not work, but at least the number of megabits is shown).
An indispensable tool for finding sources of lags on the server, as it saves not only the system load statistics, but also the performance of each process - that is, having reached the right time you can see who created this happy moment with LA> 30. And what exactly was the cause - IO programs, a swap (lack of memory), a processor or something else. In addition to more information, he is also able to suggest in two colors what parameters go beyond reasonable limits.
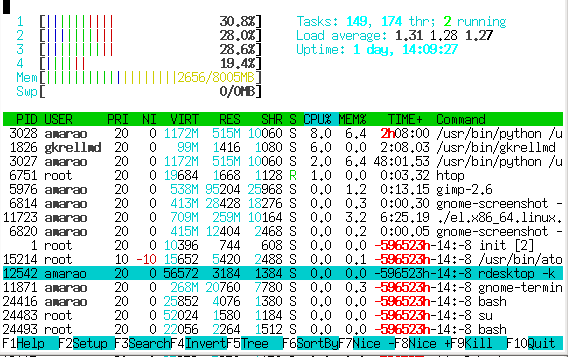
Unlike atop, htop does not collect statistics and just shows the current state. The second striking difference is the Norton-like panel with button tips from the bottom and the ability to “navigate” through the list of processes.
It supports the allocation of processes and the implementation of group operations on them (however, the fork cannot cope with them).
General statistics on the system show little (but with a scale a la progress bar), but it has extensive tools for analyzing processes, including self-indulgence with scheduling (priorities, affinity), viewing the list of open files, strace and a lot of small but pleasant features, such as contextual search by process name, mode of “tracking” the process, quick operations with the process, etc.
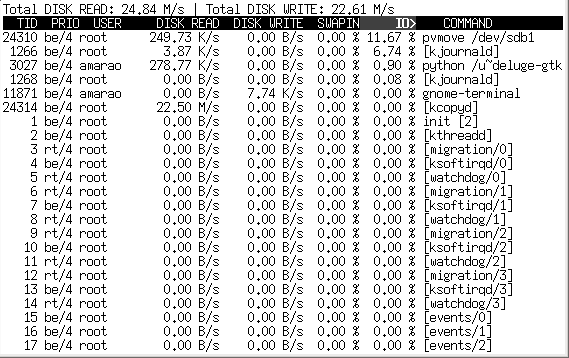
Specialized utility for analyzing disk band consumption. Unfortunately, it does not show iops (is it even possible?) Thanks to the display, kernel threads are able to point to kcopy / swapper / kflush as a source of screw crunch (which atop cannot). At the same time, it shows the total load on the IO system in Mb / s (which also cannot atop). Pretty quick.

Again, a specialized utility that allows you to monitor traffic in real time. Requires very root rights and pcap, because works almost like tcpdump. It shows interface load (only one interface in one copy is supported), traffic directions and traffic intensity.
On a medium-loaded server, which suddenly began to eat the Internet, it is possible very quickly to find the direction to which the most traffic goes (in any direction). Unfortunately, it does not show traffic distribution by process.
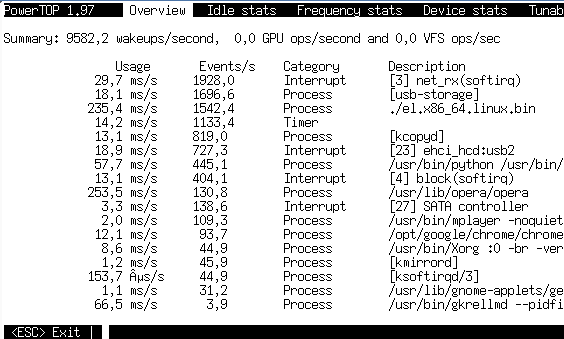
Specialized (aha, again) utility from intel for monitoring power consumption (electrical power!) By different processes. In reality, it does not show any watts, but shows the time spent on maintenance by the processor. Unique in that it shows interrupts and other kernel events on the same level with processes (which allows you to find non-trivial server overload situations and even determine which piece of hardware it comes from). With equal load, it allows you to evaluate whose driver works faster.
In addition, in the tab device stats allows you to assess the load on the device (more precisely, the device driver). For network cards (including virtual ones, such as tun) it shows pps (packets per seconds).
The idle status tab shows the state distribution of the processor (C1, C2, C3), which is very helpful in finding out if the battery is dead or something is wrong with the system? On laptops.
Well, a very specialized utility for monitoring interrupts (real interruptions, identifying them by number).

Specialized DNS traffic analyzer on the interface. It would probably be very useful when repairing DNS on a domain controller, unfortunately, Active Directory on Linux does not work very well.
Certainly useful for finding an asshole driving a bandage into indecent LA.
It is also able to aggregate addresses (so as to show their traffic in one line).

Monitor the consumption of X-server resources by different applications that are connected to it. (Found that chrome is eating up x-server resources a lot more than opera).

It specializes in the data structures of the SLAB kernel, in fact, it shows the use of memory in more subtle categories than “free / busy / cache”. View only, several sorting modes.
Monitors mysql. There is an alternative mtop, it does roughly the same, but is abandoned and (in debian) it is drunk in the area lenny -> squeeze.

Monitoring domains xen'a. It is interesting because it shows not only the memory-processor, but also disk operations with the network. Unfortunately, no control, view only. The only one of all top'ov, not intermingling in 80 columns in the output.
The list of tops that I have not looked through:
hatop - haproxy monitoring
virt-top - monitor libvirt performance
mctop - memcached status monitoring
perf-top - found the documentation , did not find perf-top itself as a tarball or package.
First, the false tops briefly:
gkrelmtop - plugin under gkrelm (performance monitor in Guy) - offtopic.
ntop - violates the text-based tradition of interactive programs and is set as a site for Apache.
libgtop - library for performance monitoring
nload - the console monitor of network activity, in contrast to the usual top'ov does not display the rating, but draws a text graph.
And then the real tops without a valid 'top' suffix in the title.

Displays network traffic from specific applications.

The contrack monitor from iptables, shows active translations with the ability to beat them. In fact, it is close to cis
top
We all know top - the simplest and most common utility from this list. It shows approximately the same as the vmstat utility, plus the process rating for memory or processor consumption. He knows absolutely nothing about network or disk booting. It allows a minimum set of operations with the process: renice, kill (in the sense of sending a signal, killing is a special case). By the name top, the suffix "-top" was obtained by all other similar utilities in this review.atop
Atop has two modes of operation - collecting statistics and monitoring the system in real time. In the statistics collection mode, atop runs as a daemon and once every N time (usually 10 minutes) throws the state into a binary log. Then on this journal atop'om (key -r and the name of the log file) you can run back and forth with the T and t buttons, watching atop'a readings with averaging over 10 minutes at any interesting point in time.
')
Unlike top, he is well aware of the existence of block devices and a network interface, and is capable of showing their loading in percent (10G doesn’t work, however, percent does not work, but at least the number of megabits is shown).
An indispensable tool for finding sources of lags on the server, as it saves not only the system load statistics, but also the performance of each process - that is, having reached the right time you can see who created this happy moment with LA> 30. And what exactly was the cause - IO programs, a swap (lack of memory), a processor or something else. In addition to more information, he is also able to suggest in two colors what parameters go beyond reasonable limits.
htop
Unlike atop, htop does not collect statistics and just shows the current state. The second striking difference is the Norton-like panel with button tips from the bottom and the ability to “navigate” through the list of processes.
It supports the allocation of processes and the implementation of group operations on them (however, the fork cannot cope with them).
General statistics on the system show little (but with a scale a la progress bar), but it has extensive tools for analyzing processes, including self-indulgence with scheduling (priorities, affinity), viewing the list of open files, strace and a lot of small but pleasant features, such as contextual search by process name, mode of “tracking” the process, quick operations with the process, etc.
iotop
Specialized utility for analyzing disk band consumption. Unfortunately, it does not show iops (is it even possible?) Thanks to the display, kernel threads are able to point to kcopy / swapper / kflush as a source of screw crunch (which atop cannot). At the same time, it shows the total load on the IO system in Mb / s (which also cannot atop). Pretty quick.
iftop
Again, a specialized utility that allows you to monitor traffic in real time. Requires very root rights and pcap, because works almost like tcpdump. It shows interface load (only one interface in one copy is supported), traffic directions and traffic intensity.
On a medium-loaded server, which suddenly began to eat the Internet, it is possible very quickly to find the direction to which the most traffic goes (in any direction). Unfortunately, it does not show traffic distribution by process.
powertop
Specialized (aha, again) utility from intel for monitoring power consumption (electrical power!) By different processes. In reality, it does not show any watts, but shows the time spent on maintenance by the processor. Unique in that it shows interrupts and other kernel events on the same level with processes (which allows you to find non-trivial server overload situations and even determine which piece of hardware it comes from). With equal load, it allows you to evaluate whose driver works faster.
In addition, in the tab device stats allows you to assess the load on the device (more precisely, the device driver). For network cards (including virtual ones, such as tun) it shows pps (packets per seconds).
The idle status tab shows the state distribution of the processor (C1, C2, C3), which is very helpful in finding out if the battery is dead or something is wrong with the system? On laptops.
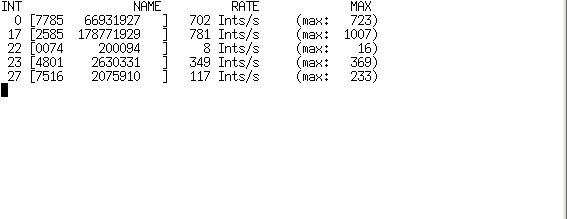
itop
Well, a very specialized utility for monitoring interrupts (real interruptions, identifying them by number).
kerneltop
Probably should show something interesting about the core. At my place he didn’t like System.map, and the lack of / proc / profile on the server.dnstop
Specialized DNS traffic analyzer on the interface. It would probably be very useful when repairing DNS on a domain controller, unfortunately, Active Directory on Linux does not work very well.
Certainly useful for finding an asshole driving a bandage into indecent LA.
jnettop
Almost iftop clone, however, has a funny mode, when it can listen to neighbors and show the top of their traffic. Not very work in the era of switches.It is also able to aggregate addresses (so as to show their traffic in one line).
sntop
A great thing for a screensaver or a public monitor — it configures pings and shows if a host is down. In principle, in working conditions with a configured config, you can quickly assess the status of a very large fleet of servers (they started it and you can immediately see who is lying in red).latencytop
I would have looked at it with interest, but it requires a special kernel config ...xrestop
Monitor the consumption of X-server resources by different applications that are connected to it. (Found that chrome is eating up x-server resources a lot more than opera).
slabtop
It specializes in the data structures of the SLAB kernel, in fact, it shows the use of memory in more subtle categories than “free / busy / cache”. View only, several sorting modes.
Software specific
apachetop
Not as useful as we would like, it shows the statistics of responses to requests. No magic, just read the Apache logs.sqtop
Top by squid logs. Taking into account the speed of their growth, first it generates intermediate statistics, and then it lets it go about it.pg_top
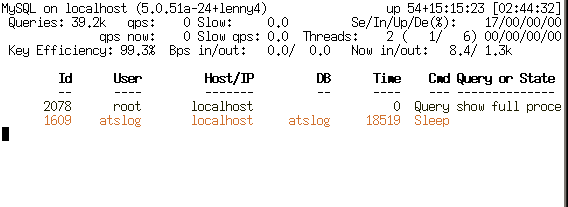
The package in debian is for some reason called ptop. Monitors postgresql loading.mytop
Monitors mysql. There is an alternative mtop, it does roughly the same, but is abandoned and (in debian) it is drunk in the area lenny -> squeeze.
xentop
Monitoring domains xen'a. It is interesting because it shows not only the memory-processor, but also disk operations with the network. Unfortunately, no control, view only. The only one of all top'ov, not intermingling in 80 columns in the output.
The list of tops that I have not looked through:
hatop - haproxy monitoring
virt-top - monitor libvirt performance
mctop - memcached status monitoring
perf-top - found the documentation , did not find perf-top itself as a tarball or package.
offTOP
First, the false tops briefly:
gkrelmtop - plugin under gkrelm (performance monitor in Guy) - offtopic.
ntop - violates the text-based tradition of interactive programs and is set as a site for Apache.
libgtop - library for performance monitoring
nload - the console monitor of network activity, in contrast to the usual top'ov does not display the rating, but draws a text graph.
And then the real tops without a valid 'top' suffix in the title.
nethogs
Displays network traffic from specific applications.
iptstate
The contrack monitor from iptables, shows active translations with the ability to beat them. In fact, it is close to cis
sh ip nat tra , but more convenient (thanks for the tip Comrade. @ Merlin_rterm).Source: https://habr.com/ru/post/114082/
All Articles