JMeter stress test recipe
Is it worth it to take on JMeter
If you are not familiar with JMeter, then, for example, you will not be able to do it with you quickly .
If you still decide to take and set aside a couple of days, then I can offer my recipe for preparing a load test on JMeter.
Script writing
In my case, it was necessary to test the service, and to understand how long it would last without optimizing the code or adding servers.
Ideally, you need to load into JMeter a script that the user is working on, and then run the script into several threads, watching the speed of request processing.
The main difficulty is how to get this script and actually this recipe is what I want to share.
It is possible that the recipe described in this post will suit you. However, if you have a lot of POST requests or have a session, then you can’t get rid of the logs from the server in JMeter by simply podsovyvaniem.
From simple to more complex
First, take a log from the server and divide the requests into two parts:
- static (you can slip them into JMeter via Access Log Sampler)
- dynamic (POST requests and requests passing parameters)
For nginx logs, I wrote some type of scripts:
awk -F '\t' '{if($4 == "GET" && $6 == "-"){print $0}}' access.log > static.log
those. we filter all simple GET requests without parameters into a separate file.awk -F '\t' '{if($6 != "-"){print $0}}' access.log > dynamic.log
In your case, the numbers of the access-log columns may differ.
Suppose that you are familiar enough with bash-programming and utilities to count the number of necessary lines in the file and finally get the following numbers
- Percentage of all static queries
- Percentage of all dynamic queries in general and individually
We will preempt statics into the script all at once through the Access Log Sampler, and we will write all the dynamic queries separately.
How to create a Test Plan in JMeter already written , so I will not repeat.
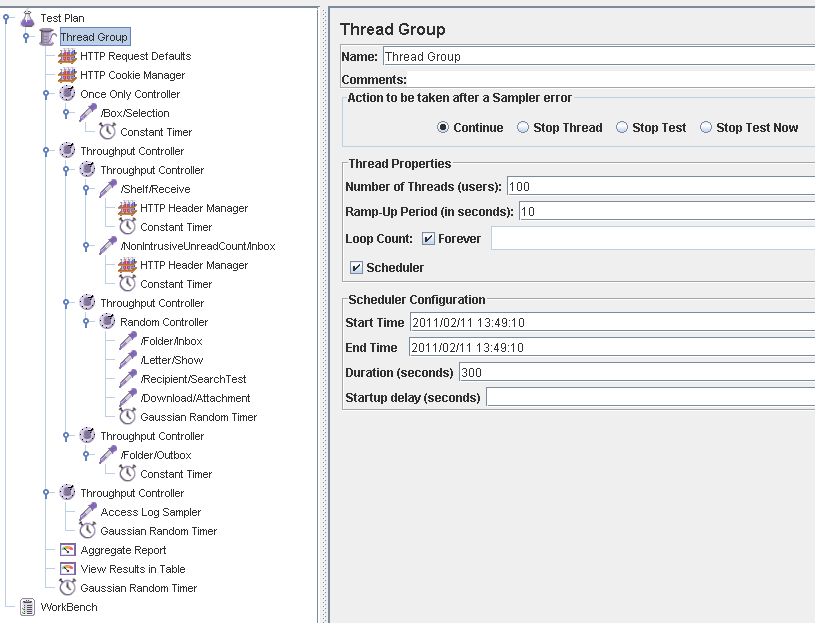
What should happen is shown in the following screenshot.
')
A description of all the elements you can easily find on the project site, so I will describe only the general principle of operation.
We add two configuration elements to the beginning.
HTTP Request Defaults to not write the server name in each HTTP Request.
HTTP Cookie Manager to store session cookies.
This is followed by Once Only Controller to initialize the session only once, because The script inside the Thread Group element in my case will run an infinite number of loops. Actually, the user will be emulated only when running a large number of cycles.
Inside this controller we insert an HTTP Request, for example, a POST request for a login into the system.
The following are two elements of the Throughput Controller .
In the first there will be all dynamic requests, and in the second all static.
For each, select the appropriate Percent Execution and enter the previously calculated numbers.
The meaning of these controllers is that JMeter will perform what is indicated inside these controllers not every cycle, but in accordance with a specified percentage of the total number of cycles.
For each of the dynamic requests we create our own HTTP Request with the necessary parameters and data to be sent. Data can be taken from the file.
There are several features:
- You should not specify the full path, otherwise there may be problems running on a remote machine
- You do not need to specify a Parameter Name if you do not want JMeter to send the file as part of a form (you can read about this in the description for the element on the site)
After each HTTP Request, we add a Constant Timer so that there is a small send interval if testing is performed on a local network with a small ping.
Different HTTP requests that have the same frequency, i.e. The completion percentage can be combined (by summing up the percentage in the Throughput Controller) and mixed inside already using the Random Controller as shown in the screenshot above.
For static requests, we prepare a log file in a special format and enter the file name in Log Access Sampler
It is extremely important to add one more timer at the end of the Thread Group, which will be triggered at the end of each cycle, otherwise JMeter will quickly fill up the server with requests and the script will represent the work unless an unrealistically fast user.
The timer value can be selected based on the user's click rate on dynamic queries and the percentage of these requests.
For example, if a user clicks something every 4 seconds, generating dynamic requests in the amount of 15% of the total number, then you can set the timer to 4000 x 0.15 = 600 ms
Running a script on a remote server
Despite the fact that the procedure is described in detail in the user manual , I didn’t manage to start everything from the first time.
Remote start has a number of features, so if you, like me, have no particular desire to understand the details, you need to ensure the following:
- Download to the remote server all the data files used by the script (to the bin directory, if you specified only the file name without a path)
- The client from which the script is launched and the remote server must be located in the local network, since the server initiates a reverse connection with the client
- The server can specify the ip-address to use
-Djava.rmi.server.hostname=xxx.xxx.xxx.xxx - I couldn't google to specify what ip-address to use for the client. It looks like JMeter will use the first one it gets. It must be from the same network as the server address
- In case of errors connecting the client to the server (see jmeter.log) or server to the client (see jmeter-server.log) - disable the firewall, selinux on them
Source: https://habr.com/ru/post/113914/
All Articles