Python (x, y)
 Python (x, y) - a set of libraries and software for numerical calculations, analysis and visualization of data based on Python. IDEs are represented by IDLE, Eclipse, and Spyder, with Qt as the basis for the GUI. I will talk briefly about the modules related to Python itself, I will give a few examples of their work. During installation, you can choose only what you need, so you should figure out what is necessary to relate to this. In addition, the story about the modules can be useful in and of itself, since they can be installed separately. The order of the modules repeats the order of the original page and the list of checkboxes of the installation.
Python - standard libraries, now uses Python 2.6.5
Spyder (Scientific PYthon Development EnviRonment) - IDE for interactive computing and data visualization, documentation
formlayout - creating forms of dialogs / widgets for editing some input parameters without writing GUI code. For example:
Copy Source | Copy HTML<br/> from formlayout import fedit<br/> <br/>datalist = [( 'Name' , 'Paul' ),<br/> ( 'Age' , 30 ),<br/> ( 'Sex' , [ 0 , 'Male' , 'Female' ]),<br/> ( 'Size' , 12 . 1 ),<br/> ( 'Eyes' , 'green' ),<br/> ( 'Married' , True),<br/> ]<br/> <br/> print "result:" , fedit(datalist, title= "Describe yourself" ,<br/> comment= "This is just an <b>example</b>." ) <br/>
And we see the action of the code with fedit ():
result: [u'Paul', 30, 'Male', 12.1, u'#008000', True]PyQwt - linking Python to the Qwt library to build 2D Qt graphics, examples
wxPython is an alternative GUI library. Although it is obvious that PyQt is moving everywhere here, it is needed for the popular ETS suite of programs, as well as the winpdb debugger
NumPy is a popular module for highly efficient work with multidimensional arrays (the core of the SciPy module), a brief introduction to NumPy
SciPy - contains modules for mathematical optimization, integration, special functions, signal processing, image processing, genetic algorithms, solving ordinary differential equations and many other problems
numexpr - fast evaluation of expressions for array elements using a vector virtual machine. For example:
')
Copy Source | Copy HTML<br/>>>> import numpy as np<br/>>>> import numexpr as ne<br/>>>> a = np.arange( 10 )<br/>>>> a<br/> array ([ 0 , 1 , 2 , 3 , 4 , 5 , 6 , 7 , 8 , 9 ])<br/>>>> b = np.arange( 0 , 20 , 2 )<br/>>>> b<br/> array ([ 0 , 2 , 4 , 6 , 8 , 10 , 12 , 14 , 16 , 18 ])<br/>>>> c = ne.evaluate( "2*a+3*b" )<br/>>>> c<br/> array ([ 0 , 8 , 16 , 24 , 32 , 40 , 48 , 56 , 64 , 72 ]) <br/>guidata - automatic GUI creation for convenient data entry and display, the simplest of examples :
Copy Source | Copy HTML<br/> import guidata<br/>guidata.qapplication()<br/> <br/> import guidata.dataset.datatypes as dt<br/> import guidata.dataset.dataitems as di<br/> <br/> class Processing (dt.DataSet):<br/> a = di.FloatItem( "Parameter #1" , default= 2 . 3 )<br/> b = di.IntItem( "Parameter #2" , min= 0 , max= 10 , default= 5 )<br/> type = di.ChoiceItem( "Processing algorithm" ,<br/> ( "type 1" , "type 2" , "type 3" ))<br/> <br/>param = Processing ()<br/>param.edit() <br/>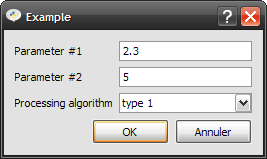
guiqwt - quick GUI creation tools, more extensive implementation of the ideas of the previous module, a page with examples
Matplotlib is a graphical 2D and pseudo 3D library, which in many cases has a syntax close to MATLAB, which allows experienced users of the latter to quickly retrain; Matplotlib has an extensive gallery of examples of images with accompanying code, which helps to get up to date, I also wrote about Matplotlib in 9 and 10 lessons of the course on Wikiversity
gnuplot is another common package for building curves and surfaces
PIL (Python Imaging Library) - working with raster graphics of various formats, reading and writing, converting, editing, and so on
IPython - the replacement of the standard Python shell, which has advanced features, there is a good story about using IPython in Habré
SetupTools is a library that allows you to automatically download, build, install, and manage Python packages in the PyPI module repository ( Python Package Index ), like package managers
ETS (Enthought Tool Suite) - a large independent software package , in which the most interesting, probably, is the 3D-visualization tool Myavi
VTK - software for visualization, 3D graphics, volume drawing and image processing
ITK - Medical Image Processing Software
mx - eGenix.com mx Distribution , contains modules for simplifying the processing of various types of data: mxDateTime (convert and parse various date and time formats), mxTextTools (text parsing and search algorithms), mxProxy, mxBeeBase (manage small databases), mxURL, mxUID, mxStack, mxQueue and mxTools
pydicom - DICOM standard medical image processing
PyOpenGL - working with OpenGL , a well-known interface for writing applications that use two-dimensional and three-dimensional computer graphics
VPython - creating three-dimensional interactive models of physical systems
SymPy is a mathematical library for symbolic computing, I once did a lesson on Wikiversity about it.
cvxport - library of convex optimization
PyWavelets - wavelet transform module
scikits.timeseries - a set of tools for analyzing time series
pyopencv - working with the OpenCV computer vision algorithms library
NetworkX - creation, manipulation and research of the structures, dynamics and functions of complex networks, graphs, for example :
Copy Source | Copy HTML<br/> import networkx as nx<br/> import matplotlib.pyplot as plt<br/> <br/>G=nx.random_geometric_graph( 200 , 0 . 125 )<br/>pos=G.pos # position is stored as member data for random_geometric_graph <br/> <br/> # find node near center (0.5,0.5) <br/>dmin= 1 <br/>ncenter= 0 <br/> for n in pos:<br/> x,y=pos[n]<br/> d=(x- 0 . 5 )** 2 +(y- 0 . 5 )** 2 <br/> if d<dmin:<br/> ncenter=n<br/> dmin=d<br/> <br/> # color by path length from node near center <br/>p=nx.single_source_shortest_path_length(G,ncenter)<br/> <br/>plt.figure(figsize=( 8 , 8 ))<br/>nx.draw_networkx_edges(G,pos,nodelist=[ncenter],alpha= 0 . 4 )<br/>nx.draw_networkx_nodes(G,pos,nodelist=p.keys(),<br/> node_size= 80 ,<br/> node_color=p.values(),<br/> cmap=plt.cm.Blues)<br/> <br/>plt.xlim(- 0 . 05 , 1 . 05 )<br/>plt.ylim(- 0 . 05 , 1 . 05 )<br/>plt.axis( 'off' )<br/>plt.show() <br/>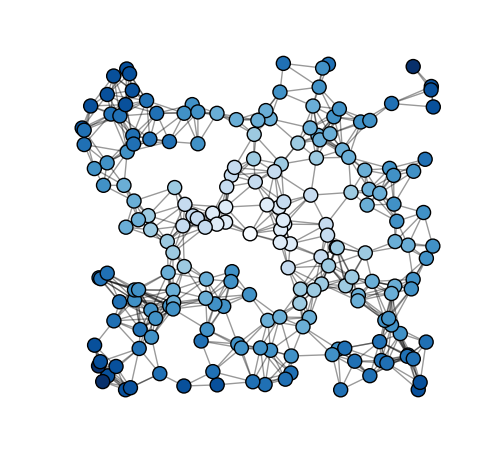
MDP — Modular Data Processing Toolkit — A Set of Managed and Self-Learning Algorithms
PyTables - package based on HDF5 library for managing large hierarchical data structures
vitables is a graphical tool for viewing and editing files in HDF5 and PyTables formats
h5py - interface for HDF5 files (unlike PyTables, h5py provides direct access to the full HDF5 C library)
pyhdf - interface for HDF4 files
netcdf4 - working with netCDF4 (Network Common Data Form), a set of software libraries and machine-independent data formats that support the creation, access and exchange of scientific data sets oriented
GDAL (Geospatial Data Abstraction Library) - working with geospace data
PP (Parallel Python) - parallel execution of Python code on systems with multiple processors or cores, examples
SendKeys is a Python module for Windows that can send one or more keystrokes or a key combination to the active window. You can even forget about such goals for a while and make a prank, for example:
Copy Source | Copy HTML<br/> import SendKeys<br/>SendKeys.SendKeys( """ <br/> {LWIN} <br/> {PAUSE .25} <br/> {UP 3} <br/> {ENTER} <br/> {PAUSE 1} <br/> notepad{ENTER} <br/> {PAUSE 2} <br/> Hello{SPACE}World! <br/> {PAUSE 3} <br/> %{F4} <br/> {PAUSE 2} <br/> {RIGHT} <br/> {PAUSE 1} <br/> {ENTER} <br/> """ ) <br/>What's going on here? Exactly what I would do in the absence of a mouse, in order to get the same result that will turn out. I would press the left windows {LWIN} key, that is, I went to the Start menu of my Windows XP, then three times the "UP" key {UP 3}, so I went to "Run ...", I would press the {ENTER key }, typed notepad and started the notepad, wrote a typical HelloWorld in it, closed it with alt-f4, which is written as% {F4}, a typical dialog about saving data “Yes No Cancel” appeared, pressed the {RIGHT} key to select "No" and {ENTER}. Pauses are needed so that the necessary programs can be opened and the corresponding characters entered.
Simultaneously with the execution of this code, you should not
pywinauto - a suite of modules for automating the Microsoft Windows GUI (mouse and keyboard actions)
pyvisa - control of all types of measuring devices using various buses (GPIB, RS232, USB)
PyParallel - parallel port access library
PySerial - serial port access library
Cython is a Python based language that allows you to more closely use the speed capabilities of C
psyco is a module that allows you to increase the speed of Python code execution, and in many cases it is enough just to add just two lines before the main code (or a bit more if you wrap them in try-except ImportError):
Copy Source | Copy HTML<br/> import psyco<br/>psyco.full() <br/>py2exe is a tool that converts Python scripts to standalone Windows executable files, it is written a little about it in Habré
Sphinx is a documentation generation tool that uses reStructuredText as a markup language; with the help of Sphinx, the documentation of Python itself , of Sphinx itself , and many other libraries included in Python (x, y)
docutils - a text processor for translating plain text documentation into useful formats such as HTML, XML or LaTeX (including reStructuredText)
pygments - source code highlighting, understands most of the languages used, can produce html output, images, LaTeX and so on
ReportLab - creating pdf documents
rst2pdf is a tool for converting reStructuredText to PDF using ReportLab
simplejson - simple, fast JSON (JavaScript Object Notation) encoder / decoder
xlrd - extracting data from Microsoft Excel files, habre article
xlwt - create spreadsheet files that are compatible with Microsoft Excel, OpenOffice.org Calc, and Gnumeric
pylint - analyzing the code for finding errors and bad places, just run from the command line
pylint example.py and pylint will display a large summary of what your code is thinking of, examplewinpdb - interactive program debugger
Source: https://habr.com/ru/post/113065/
All Articles