Accuracy of meteorological forecasts
The variety of temperatures observed this winter reminded me of the Habrayuzer aib project MyCli.me , collecting weather forecasts from several hydrometeorological sites at once and making it possible to increase their accuracy by averaging "in the head".
Actually, a year and a half ago, when I first met the site, the first thing that came to me was that the statistics from it was an ideal material for an informal assessment of the quality of weather predictions. If to be completely accurate, the site itself has a system of rating the accuracy of forecasts , choosing the best "predictor" for each city entered in the register over the past month.
But I wanted a longer and “weighted” assessment.
')
Cities involved in the analysis: Moscow, St. Petersburg, Nizhny Novgorod, Kiev, Sochi - evenly from different parts of the European part of Russia and Ukraine. Krasnoyarsk, Novosibirsk and other nearby cities had to be eliminated because of the frequent strong (up to 22 degrees) errors in many meteosites, which greatly change, as a result, the general statistics of the quality of forecasting.
The analysis period: 3 months - November, December, January. For Moscow during these 3 months, the maximum actual temperature was + 13, the minimum is -23, i.e. almost the entire winter range of values was observed.
We make a sampling of the averaged absolute (by module) error values for different forecasts “for 1 day”, “for 2 days”, ..., “for 5 days” (only for day temperature). I want to warn you right away (because I was repeatedly indignant myself ) that the abscissa axis is slightly raised - only for readability of the graphics.

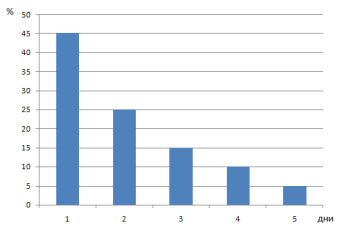
We will try to determine the cumulative accuracy of the forecast for a particular day. To do this, assign weights (ratios) [45%, 25%, 15%, 10%, 5%] to forecast errors for 1, 2, ... and 5 days, respectively. This is an exponentially weighted average (EMA) with a period of T = 2 days (that is, any pair of coefficients that are 2 days apart differ by 2,718 times). It is logical to assume that an error in the forecast one day before the deadline may cause more unpleasant consequences than 4 or 5. Graphically, the weights look like this:
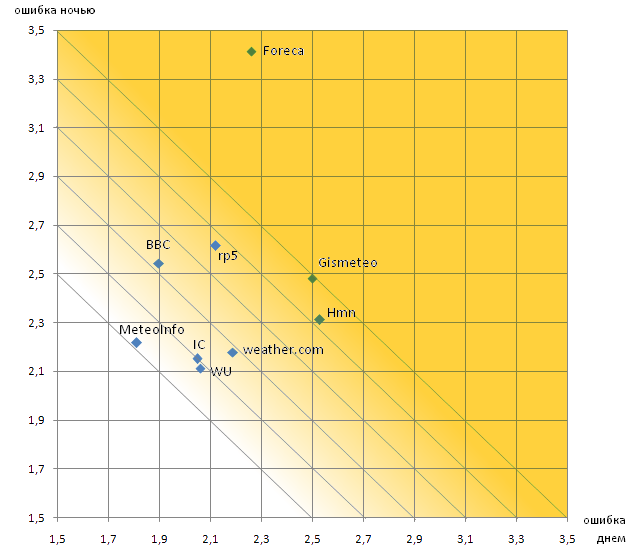
In order for the graphic image to be clearer, we will calculate the average error with these weights separately for daytime and separately for nighttime temperatures and set them aside in different axes. Accordingly, a sign of the high quality of the forecast is proximity to the point (0; 0), this fact is additionally highlighted with a fill. The sharp deterioration of BBC Weather’s positions on this chart is interesting. his daily forecasts are among the most accurate, while night forecasts are not in the top five.
To voice the conclusions is a thankless task - everyone can make them for himself. Someone is more interested in the forecast "for tomorrow", someone "for 5 days ahead", someone more important is the temperature during the day, and someone, and vice versa. Of course, some sites are not here at all, and some sites have significant competitive advantages, for example, in the length of the published forecast. The task was not to find "the best meteosite", but only to compare the accuracy of short-term forecasts for the next past 3-month period.
If the comparison you are interested in - you can try to do a similar analysis for 12 months.
Actually, a year and a half ago, when I first met the site, the first thing that came to me was that the statistics from it was an ideal material for an informal assessment of the quality of weather predictions. If to be completely accurate, the site itself has a system of rating the accuracy of forecasts , choosing the best "predictor" for each city entered in the register over the past month.
But I wanted a longer and “weighted” assessment.
')
Input data
Cities involved in the analysis: Moscow, St. Petersburg, Nizhny Novgorod, Kiev, Sochi - evenly from different parts of the European part of Russia and Ukraine. Krasnoyarsk, Novosibirsk and other nearby cities had to be eliminated because of the frequent strong (up to 22 degrees) errors in many meteosites, which greatly change, as a result, the general statistics of the quality of forecasting.
The analysis period: 3 months - November, December, January. For Moscow during these 3 months, the maximum actual temperature was + 13, the minimum is -23, i.e. almost the entire winter range of values was observed.
First cut: short-term or long-term
We make a sampling of the averaged absolute (by module) error values for different forecasts “for 1 day”, “for 2 days”, ..., “for 5 days” (only for day temperature). I want to warn you right away (because I was repeatedly indignant myself ) that the abscissa axis is slightly raised - only for readability of the graphics.
Second cut: day or night
We will try to determine the cumulative accuracy of the forecast for a particular day. To do this, assign weights (ratios) [45%, 25%, 15%, 10%, 5%] to forecast errors for 1, 2, ... and 5 days, respectively. This is an exponentially weighted average (EMA) with a period of T = 2 days (that is, any pair of coefficients that are 2 days apart differ by 2,718 times). It is logical to assume that an error in the forecast one day before the deadline may cause more unpleasant consequences than 4 or 5. Graphically, the weights look like this:
In order for the graphic image to be clearer, we will calculate the average error with these weights separately for daytime and separately for nighttime temperatures and set them aside in different axes. Accordingly, a sign of the high quality of the forecast is proximity to the point (0; 0), this fact is additionally highlighted with a fill. The sharp deterioration of BBC Weather’s positions on this chart is interesting. his daily forecasts are among the most accurate, while night forecasts are not in the top five.
In the "dry residue"
To voice the conclusions is a thankless task - everyone can make them for himself. Someone is more interested in the forecast "for tomorrow", someone "for 5 days ahead", someone more important is the temperature during the day, and someone, and vice versa. Of course, some sites are not here at all, and some sites have significant competitive advantages, for example, in the length of the published forecast. The task was not to find "the best meteosite", but only to compare the accuracy of short-term forecasts for the next past 3-month period.
If the comparison you are interested in - you can try to do a similar analysis for 12 months.
Source: https://habr.com/ru/post/112958/
All Articles