What SSD manufacturers have been keeping back [Updated!]
This is a translation of an article from the SSD Review website. In truth, this is not exactly a translation - rather, squeezing the meaning with the addition of graphs that speak for themselves. I deliberately disregarded advertising drives Intel. Well, one more thing - the author strangely distorts, first showing the predominance of random 4-8k write, and then giving on the charts as a measure of the performance of random 4-8k read. The feeling that he himself keeps back something. It would be nice if someone from the competent people leave their opinion in the comments.
UPD:
The accuracy of the information in the article is confirmed empirically. I did the experiments, wrote the parser and posted the results of the deseven browser , for which I thank him so much. You can look at the tablet with its data at the end of the article.
Are you thinking about buying an SSD? It will be about the most important thing to know. This information will show in a favorable light only a couple or two manufacturers, while the rest will be in an extremely disadvantageous position.
')
So what is the hype?
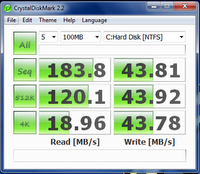
Let's get down to business. Take a look at the graphics and tell me which of these SSDs would you choose?
Okay, some of you have already caught the point. Let's try again. Take a closer look at a couple of graphs and tell me - what configuration will give a feeling of greater performance for the average user?
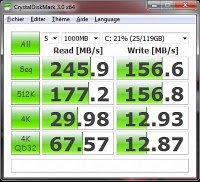
Those of you who find the configuration on the right chart faster are absolutely right.
When we choose our drive for a purchase, the “huge” numbers of sequential read / write are the most striking. In the upper right graph, for example, this figure is 245 MB / s. It must be a bit faster than the one whose graph is on the left with the figure of 183 MB / s, right?
So, not so. To determine which SSD is best for you, you first need to figure out what kind of disk activity is most typical for your system.
Fortunately, I have good technical support from people who are knowledgeable in SSD technology. Recently, one of them wrote a post that attracted my attention. He used Diskmon to track disk activity in the process of everyday computer use - he launched applications, used the Internet, listened to music, and so on. Based on this, it was revealed what percentage of the total disk activity a particular type of access takes when using a computer for everyday tasks.
As a result, he made a conclusion about which everyone seems to know, but for some reason they refuse to understand to the end. Sequential access to large blocks of data is used by the average user less than 1% of the time, while the main disk activity — more than 50%, as can be seen from the numbers above — is “8k random write,” that is, random writing by small blocks.
To make you buy an SSD, manufacturers show us the speed of disk operation, which is the smallest (0.44% in total) share of all disk activity!
Given this information, take a look at the graphs once again - on the part where the “4kb random write” speed is indicated. I think you got the idea.
At the time of launching the application or the OS itself, the computer actively uses dynamic-link libraries (dll). They are thousands of small programs that are called by the main program as needed, without being loaded into memory resident. To read them from disk, “4-8k random access” is most often used, and the faster they load, the faster the application or OS starts. Similarly, the faster they can be called in the process of the program, the faster the program.
In other words, “4-8km random access” is a key type of disk operation that influences the SSD performance seen by the user, and it should be oriented towards it when purchasing.
It should be noted that for some activities, such as video editing, the sequential read / write speed will not be the last value. However, a typical user such high speed is almost never used.
As you understand, manufacturers rarely indicate the speed of random reading / writing in blocks of 4-8 Kb on the packaging of their SSD-drives. These data can only be found on the Internet, from various tests.
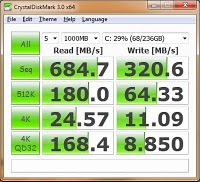
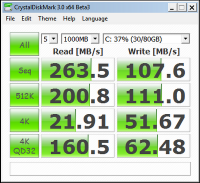
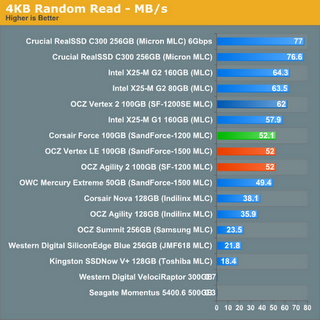
And finally - random 4k read performance for some disks.
PS from the translator, that is me.
In the original article, in contrast to the text above:
Source article address: thessdreview.com/buyers-guide/the-ssd-manufacturers-bluff
Some users have questioned the veracity of the data given in the article. Questions caused such things as:
The user deseven tested the Diskmon utility, scored about 125k read / write requests during daily activities, parsed the log and summarized the statistics:
By the way, I also tried to repeat this experience earlier, but on my XP diskmon does not show anything at all, that is, it does not collect statistics. Googling solution could not.
Findings:
Technically, the article is most likely correct, at least in that 4-8k random r / w is the main disk activity. The predominance of reading over the record in the source data is most likely due to the features of the author’s OS and its settings.
UPD:
The accuracy of the information in the article is confirmed empirically. I did the experiments, wrote the parser and posted the results of the deseven browser , for which I thank him so much. You can look at the tablet with its data at the end of the article.
Are you thinking about buying an SSD? It will be about the most important thing to know. This information will show in a favorable light only a couple or two manufacturers, while the rest will be in an extremely disadvantageous position.
')
So what is the hype?
Let's get down to business. Take a look at the graphics and tell me which of these SSDs would you choose?
Okay, some of you have already caught the point. Let's try again. Take a closer look at a couple of graphs and tell me - what configuration will give a feeling of greater performance for the average user?
Those of you who find the configuration on the right chart faster are absolutely right.
When we choose our drive for a purchase, the “huge” numbers of sequential read / write are the most striking. In the upper right graph, for example, this figure is 245 MB / s. It must be a bit faster than the one whose graph is on the left with the figure of 183 MB / s, right?
So, not so. To determine which SSD is best for you, you first need to figure out what kind of disk activity is most typical for your system.
Fortunately, I have good technical support from people who are knowledgeable in SSD technology. Recently, one of them wrote a post that attracted my attention. He used Diskmon to track disk activity in the process of everyday computer use - he launched applications, used the Internet, listened to music, and so on. Based on this, it was revealed what percentage of the total disk activity a particular type of access takes when using a computer for everyday tasks.
| Top 5 Most Frequent Drive Accesses by Type and Percentage | |
|---|---|
| 8K Write | 56.35% |
| 8K Read | 7.60% |
| 1K Write | 6.10% |
| 16K Write | 5.79% |
| 64K Read | 2.49% |
| Top 5 summary | 78.33% |
| Largest access size in top 50: 256K Read | 0.44% |
As a result, he made a conclusion about which everyone seems to know, but for some reason they refuse to understand to the end. Sequential access to large blocks of data is used by the average user less than 1% of the time, while the main disk activity — more than 50%, as can be seen from the numbers above — is “8k random write,” that is, random writing by small blocks.
To make you buy an SSD, manufacturers show us the speed of disk operation, which is the smallest (0.44% in total) share of all disk activity!
Given this information, take a look at the graphs once again - on the part where the “4kb random write” speed is indicated. I think you got the idea.
At the time of launching the application or the OS itself, the computer actively uses dynamic-link libraries (dll). They are thousands of small programs that are called by the main program as needed, without being loaded into memory resident. To read them from disk, “4-8k random access” is most often used, and the faster they load, the faster the application or OS starts. Similarly, the faster they can be called in the process of the program, the faster the program.
In other words, “4-8km random access” is a key type of disk operation that influences the SSD performance seen by the user, and it should be oriented towards it when purchasing.
It should be noted that for some activities, such as video editing, the sequential read / write speed will not be the last value. However, a typical user such high speed is almost never used.
As you understand, manufacturers rarely indicate the speed of random reading / writing in blocks of 4-8 Kb on the packaging of their SSD-drives. These data can only be found on the Internet, from various tests.
And finally - random 4k read performance for some disks.
PS from the translator, that is me.
In the original article, in contrast to the text above:
- More emotions and promises to “reverse the whole idea of SSD with this information” :)
- More information about drives whose performance is displayed on charts.
- More Intel SSD ads
- Graphics of a pair of top-end SSDs from other manufacturers, which are only “matched” to Intel, and if they are suddenly overtaken, it means that they have a biting price, not like Intel :)
Source article address: thessdreview.com/buyers-guide/the-ssd-manufacturers-bluff
Updated:
Some users have questioned the veracity of the data given in the article. Questions caused such things as:
- Is the 4-8k random read / write operation really important? Is not a custom article in general?
- Why in the article data write operations are so much higher than read in quantity?
- why, at the same time, the author very imperceptibly goes over in his examples to the demonstration of data regarding “random read”, and disguises this as the words “random access”, meaning read, and before the reader showing what is more important than write.
The user deseven tested the Diskmon utility, scored about 125k read / write requests during daily activities, parsed the log and summarized the statistics:
| ------ strut ------- Block size ------- one more ------:) ------ | Read | Write | Summary |
| 1K | 0.02% | 0.45% | 0.47% |
| 8K | 45.13% | 32.01% | 77.14% |
| 16K | 4.3% | 1.5% | 5.8% |
| 32K | 0.79% | 0.3% | 1.09% |
| Rest | 12.01% | 3.49% | 15.5% |
| Everything | 62.3% | 37.7% | 100% |
By the way, I also tried to repeat this experience earlier, but on my XP diskmon does not show anything at all, that is, it does not collect statistics. Googling solution could not.
Findings:
Technically, the article is most likely correct, at least in that 4-8k random r / w is the main disk activity. The predominance of reading over the record in the source data is most likely due to the features of the author’s OS and its settings.
Source: https://habr.com/ru/post/112835/
All Articles