Garbage Collection clearly
Recently, I have been working with clients on JVM configuration issues. It looks like the situation that far from all developers and administrators are aware of how the garbage collection works and how the JVM uses memory. Therefore, I decided to give an introduction to this topic with a clear example. The post does not pretend to cover the whole amount of knowledge about the garbage collection or setting up a JVM (it is huge), well, in the end, a lot of good things are written about it on the Web.
The post is dedicated to HotSpot JVM - the “regular” JVM from Oracle (formerly Sun), the JVM that you most likely will use in Windows. In the case of Linux, this could be an open source JVM. Or, the JVM can be bundled with other software, such as WebLogic, or you can even use Oracle's Jrockit JVM (formerly BEA). Or other JVMs from IBM, Apple, and others. Most of these “other” JVMs work along a HotSpot-like scheme, with the exception of Jrockit, whose memory management is different from others and which, for example, does not have dedicated Permanent Generation (see below).
Let's start with how JVM uses memory. In JVM memory is divided into two segments - Heap and Permanent Generation. In the diagram, the Permanent Generation is green, the rest is heap.
')
Permanent generation is used only by the JVM to store the necessary data, including metadata about the objects created. Each time a JVM object is created, it will put some data in the PG. Accordingly, the more objects you create of different types, the more “living space” is required in PG.
The size of the PG can be set with two JVM parameters: -XX: PermSize sets the minimum or initial size of the PG, and -XX: MaxPermSize sets the maximum size. When launching large Java applications, we often set the same values for these parameters, so the PG is created immediately with the size “to the maximum”, which can increase performance, since changing the size of PG is an expensive (time consuming) operation. Determining the same values for these two parameters can save the JVM from performing additional operations, such as checking the need to change the size of the PG and, of course, directly changing it.
Heap is the main memory segment where all your objects are stored. Heap is divided into two subsegments, Old Generation and New Generation. New Generation, in turn, is divided into Eden and two Survivor segments.
The heap size can also be specified by parameters. The diagram is Xms (minimum) and -Xmx (maximum). Advanced options control heap segment sizes. We will later see one of them, the rest beyond the scope of this post.
When creating an object, when you write something like byte [] data = new byte [1024] , this object is created in the Eden segment. New objects are created in Eden. In addition to the actual data for our byte array, there is also a link (pointer) to this data.
Further explanation is simplified. When you want to create a new object, but there is no room in Eden, the JVM runs a garbage collection, which means that the JVM searches all the objects in memory that are no longer needed and gets rid of them.
Garbage collection is awesome! If you have ever programmed in languages like C or Objective-C, then you know that manual memory management is a tedious thing and sometimes causes errors. Having a JVM that automatically takes care of unused objects makes development easier and reduces debugging time. If you have never written in such languages, then take C and try to write a program, and feel how valuable what is provided by your language is completely free.
There are many algorithms that the JVM can use to perform the garbage collection. You can specify which ones will be used by the JVM using parameters.
Let's look at an example. Suppose we have the following code:
In Eden, five objects are created ("placed"), as shown by the five yellow squares in the diagram. After “something,” we release a, b, c, and e, assigning null to the links. Bearing in mind that there are no more references to them, they are no longer needed, and are shown in red in the second diagram. However, we still need String d (shown in green).

If we try to place another object, the JVM finds that Eden is full and needs to be cleaned. The simplest algorithm for the garbage collection is called the Copy Collection, and it works as shown in the diagram. In the first stage, Mark marks unused objects (red). On the second (Copy) objects that are still needed (d) are copied into the survivor segment - the square on the right. There are two Survivor segments, and they are smaller than Eden. Now all the objects we want to save are copied to Survivor, and the JVM simply removes everything from Eden. That's all.
This algorithm creates something called the moment “when the world stopped”. During the execution of the GC, all other threads in the JVM are paused, so that none of them try to get into the memory after we have copied everything from there, which would lead to the loss of what has been done. This is not a great problem if it is in a small application, but if we have a serious program in our hands, say, with an 8-gigabyte heap, then the GC will take a long time - seconds or even minutes. Naturally, stopping the application every time is not an option. Therefore, there are other algorithms, and are used frequently. Copy Collection works well if we have a lot of garbage and few useful objects.
In this post we will talk about two common algorithms. For those interested, there is a lot of information on the Web and some good books.
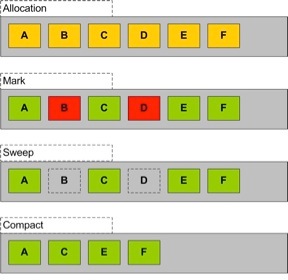
The following algorithm is called Mark-Sweep-Compact Collection. The algorithm has three stages:
1) Mark: marks unused objects (red).
2) “Sweep”: these objects are deleted from memory. Notice the empty slots in the diagram.
3) “Compact”: objects are placed occupying free slots, which frees up space in case you need to create a “large” object.
But this is all theory, so let's see how this works, using an example. Fortunately, the JDK has a visual tool for real-time monitoring of the JVM, namely jvisualvm. It lies right in the bin JDK. We will use it a bit later, at first we will be engaged in the application.
I used Maven for development, builds and dependencies, but you don’t need it - just compile and run the application if you like.
I chose a simple JAR (98) and everything defaults for the rest. Then I switched to the memoryTool directory and edited pom.xml (below, added the plugin block). This allowed me to launch the application directly from Maven, passing the necessary parameters.
If you prefer not to use Maven, you can start the application with the following command:
Wherein:
-Xms determine the initial / minimum heap size in 512 MB
-Xmx determine the maximum heap size in 512 MB
-XX: NewRatio determine the size of the old generation is three times larger than the size of the new generation
-XX: + PrintGCTimeStamps, -XX: + PrintGCDetails and -Xloggc: gc.log JVM prints additional information regarding the garbage collection to the gc.log file
-classpath define classpath
com.redstack.App main class
Below is the code of the main class. A simple program in which we create objects and then throw them out, so it’s clear how much memory is used and we can see what happens with the JVM.
To build and run the code, use the following Maven command:
mvn package exec: exec
As soon as you compile and be ready for further action, run it and jvisualvm. If you have not used jvisualvm before, then you need to install the VisualGC plug-in: select Plugins in the Tools menu, then the Available Plugins tab. Select Visual GC and click Install.
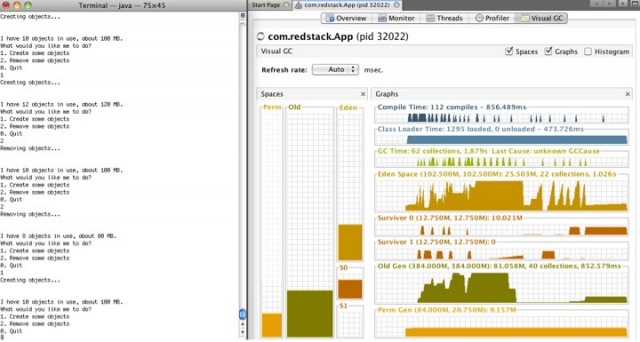
You should see a list of JVM processes. Double-click on the volume in which your application runs (in this example, com.redstack.App) and open the Visual GC tab. Something like the one in the screenshot below should appear.

Please note that you can visually observe the state of the permanent generation, old generation, eden and survivor segments (S0 and S1). Colored columns show used memory. On the right is the historical view, which shows when the JVM performed garbage collections and the amount of memory in each of the segments.
In the application window, start creating objects (option 1) and watch what happens in Visual GC. Note that new objects are always created in eden. Now make a couple of objects unnecessary (option 2). You may not see the changes in Visual GC. This is because the JVM does not clean this space until the garbage collection procedure is complete.
To initiate the garbage collection, create more objects by filling in Eden. Please note what happens at the time of filling. If there is a lot of garbage in Eden, you will see how objects from Eden “move” to the survivor. However, if there is little rubbish in Eden, you will see objects moving into old generation. This happens when the objects that need to be left are larger than survival.
Also observe the gradual increase in Permanent Generation.
Try to fill in Eden, but not to the end, then throw away almost all the objects, leave only 20 MB. It turns out that Eden is mostly filled with garbage. After that create more objects. This time you will see that objects from Eden are being transferred to Survivor.
And now let's see what happens if we don’t have enough memory. Create objects until they are 460 mb. Please note that both Eden and Old Generation are almost completely filled. Create a couple more objects. When there is no more memory, the application will “fall” with the exception OutOfMemoryException. You may have already encountered similar behavior and wondered why it happened - especially if you had a large amount of physical memory on a computer and you were surprised how such a thing could happen, that there was not enough memory - now you know why. If it so happens that the Permanent Generation is full (quite difficult in the case of our example to achieve this), you will have another exception thrown, indicating that PermGen is full.
And finally, another way to see what was happening is to access the log. Here is a little bit of mine:
In the log you can see what happened in the JVM - note that the algorithm used is the Concurrent Mark Sweep Compact Collection algorithm (CMS), there is a description of the stages and YG - Young Generation.
You can use these settings in the "production". There are even tools that visualize the log.
Well, that ended our brief introduction to the theory and practice of the JVM garbage collection. I hope that the example application helped you to clearly understand what is happening in the JVM when your application is running.
Thanks to Rupesh Ramachandran for what he taught me about the JVM and garbage collection settings.
The post is dedicated to HotSpot JVM - the “regular” JVM from Oracle (formerly Sun), the JVM that you most likely will use in Windows. In the case of Linux, this could be an open source JVM. Or, the JVM can be bundled with other software, such as WebLogic, or you can even use Oracle's Jrockit JVM (formerly BEA). Or other JVMs from IBM, Apple, and others. Most of these “other” JVMs work along a HotSpot-like scheme, with the exception of Jrockit, whose memory management is different from others and which, for example, does not have dedicated Permanent Generation (see below).
Let's start with how JVM uses memory. In JVM memory is divided into two segments - Heap and Permanent Generation. In the diagram, the Permanent Generation is green, the rest is heap.
')
The permanent generation
Permanent generation is used only by the JVM to store the necessary data, including metadata about the objects created. Each time a JVM object is created, it will put some data in the PG. Accordingly, the more objects you create of different types, the more “living space” is required in PG.
The size of the PG can be set with two JVM parameters: -XX: PermSize sets the minimum or initial size of the PG, and -XX: MaxPermSize sets the maximum size. When launching large Java applications, we often set the same values for these parameters, so the PG is created immediately with the size “to the maximum”, which can increase performance, since changing the size of PG is an expensive (time consuming) operation. Determining the same values for these two parameters can save the JVM from performing additional operations, such as checking the need to change the size of the PG and, of course, directly changing it.
Heap
Heap is the main memory segment where all your objects are stored. Heap is divided into two subsegments, Old Generation and New Generation. New Generation, in turn, is divided into Eden and two Survivor segments.
The heap size can also be specified by parameters. The diagram is Xms (minimum) and -Xmx (maximum). Advanced options control heap segment sizes. We will later see one of them, the rest beyond the scope of this post.
When creating an object, when you write something like byte [] data = new byte [1024] , this object is created in the Eden segment. New objects are created in Eden. In addition to the actual data for our byte array, there is also a link (pointer) to this data.
Further explanation is simplified. When you want to create a new object, but there is no room in Eden, the JVM runs a garbage collection, which means that the JVM searches all the objects in memory that are no longer needed and gets rid of them.
Garbage collection is awesome! If you have ever programmed in languages like C or Objective-C, then you know that manual memory management is a tedious thing and sometimes causes errors. Having a JVM that automatically takes care of unused objects makes development easier and reduces debugging time. If you have never written in such languages, then take C and try to write a program, and feel how valuable what is provided by your language is completely free.
There are many algorithms that the JVM can use to perform the garbage collection. You can specify which ones will be used by the JVM using parameters.
Let's look at an example. Suppose we have the following code:
String a = "hello"; String b = "apple"; String c = "banana"; String d = "apricot"; String e = "pear"; // // - // a = null; b = null; c = null; e = null; In Eden, five objects are created ("placed"), as shown by the five yellow squares in the diagram. After “something,” we release a, b, c, and e, assigning null to the links. Bearing in mind that there are no more references to them, they are no longer needed, and are shown in red in the second diagram. However, we still need String d (shown in green).
If we try to place another object, the JVM finds that Eden is full and needs to be cleaned. The simplest algorithm for the garbage collection is called the Copy Collection, and it works as shown in the diagram. In the first stage, Mark marks unused objects (red). On the second (Copy) objects that are still needed (d) are copied into the survivor segment - the square on the right. There are two Survivor segments, and they are smaller than Eden. Now all the objects we want to save are copied to Survivor, and the JVM simply removes everything from Eden. That's all.
This algorithm creates something called the moment “when the world stopped”. During the execution of the GC, all other threads in the JVM are paused, so that none of them try to get into the memory after we have copied everything from there, which would lead to the loss of what has been done. This is not a great problem if it is in a small application, but if we have a serious program in our hands, say, with an 8-gigabyte heap, then the GC will take a long time - seconds or even minutes. Naturally, stopping the application every time is not an option. Therefore, there are other algorithms, and are used frequently. Copy Collection works well if we have a lot of garbage and few useful objects.
In this post we will talk about two common algorithms. For those interested, there is a lot of information on the Web and some good books.
The following algorithm is called Mark-Sweep-Compact Collection. The algorithm has three stages:
1) Mark: marks unused objects (red).
2) “Sweep”: these objects are deleted from memory. Notice the empty slots in the diagram.
3) “Compact”: objects are placed occupying free slots, which frees up space in case you need to create a “large” object.
But this is all theory, so let's see how this works, using an example. Fortunately, the JDK has a visual tool for real-time monitoring of the JVM, namely jvisualvm. It lies right in the bin JDK. We will use it a bit later, at first we will be engaged in the application.
I used Maven for development, builds and dependencies, but you don’t need it - just compile and run the application if you like.
mvn archetype:generate -DarchetypeGroupId=org.apache.maven.archetypes -DgroupId=com.redstack -DartifactId=memoryTool I chose a simple JAR (98) and everything defaults for the rest. Then I switched to the memoryTool directory and edited pom.xml (below, added the plugin block). This allowed me to launch the application directly from Maven, passing the necessary parameters.
 <project xmlns = "http://maven.apache.org/POM/4.0.0"
   xmlns: xsi = "http://www.w3.org/2001/XMLSchema-instance"
   xsi: schemaLocation = "http://maven.apache.org/POM/4.0.0 http://maven.apache.org/xsd/maven-4.0.0.xsd">
   <modelVersion> 4.0.0 </ modelVersion>
   <groupId> com.redstack </ groupId>
   <artifactId> memoryTool </ artifactId>
   <version> 1.0-SNAPSHOT </ version>
   <packaging> jar </ packaging>
   <name> memoryTool </ name>
   <url> http://maven.apache.org </ url>
   <properties>
     <project.build.sourceEncoding> UTF-8 </project.build.sourceEncoding>
   </ properties>
   <build>
     <plugins>
       <plugin>
         <artifactId> maven-compiler-plugin </ artifactId>
         <version> 2.0.2 </ version>
         <configuration>
           <source> 1.6 </ source>
           <target> 1.6 </ target>
         </ configuration>
       </ plugin>
 ---------------------
       <plugin>
         <groupId> org.codehaus.mojo </ groupId>
         <artifactId> exec-maven-plugin </ artifactId>
         <configuration>
           <executable> java </ executable>
           <arguments>
             <argument> -Xms512m </ argument>
             <argument> -Xmx512m </ argument>
             <argument> -XX: NewRatio = 3 </ argument>
             <argument> -XX: + PrintGCTimeStamps </ argument>
             <argument> -XX: + PrintGCDetails </ argument>
             <argument> -Xloggc: gc.log </ argument>
             <argument> -classpath </ argument>
             <classpath />
             <argument> com.redstack.App </ argument>
           </ arguments>
         </ configuration>
       </ plugin>
 ----------------------
     </ plugins>
   </ build>
   <dependencies>
     <dependency>
       <groupId> junit </ groupId>
       <artifactId> junit </ artifactId>
       <version> 3.8.1 </ version>
       <scope> test </ scope>
     </ dependency>
   </ dependencies>
 </ project>
If you prefer not to use Maven, you can start the application with the following command:
java -Xms512m -Xmx512m -XX:NewRatio=3 -XX:+PrintGCTimeStamps -XX:+PrintGCDetails -Xloggc:gc.log -classpath <whatever> com.redstack.App Wherein:
-Xms determine the initial / minimum heap size in 512 MB
-Xmx determine the maximum heap size in 512 MB
-XX: NewRatio determine the size of the old generation is three times larger than the size of the new generation
-XX: + PrintGCTimeStamps, -XX: + PrintGCDetails and -Xloggc: gc.log JVM prints additional information regarding the garbage collection to the gc.log file
-classpath define classpath
com.redstack.App main class
Below is the code of the main class. A simple program in which we create objects and then throw them out, so it’s clear how much memory is used and we can see what happens with the JVM.
package com.redstack; import java.io.*; import java.util.*; public class App { private static List objects = new ArrayList(); private static boolean cont = true; private static String input; private static BufferedReader in = new BufferedReader(new InputStreamReader(System.in)); public static void main(String[] args) throws Exception { System.out.println("Welcome to Memory Tool!"); while (cont) { System.out.println( "\n\nI have " + objects.size() + " objects in use, about " + (objects.size() * 10) + " MB." + "\nWhat would you like me to do?\n" + "1. Create some objects\n" + "2. Remove some objects\n" + "0. Quit"); input = in.readLine(); if ((input != null) && (input.length() >= 1)) { if (input.startsWith("0")) cont = false; if (input.startsWith("1")) createObjects(); if (input.startsWith("2")) removeObjects(); } } System.out.println("Bye!"); } private static void createObjects() { System.out.println("Creating objects..."); for (int i = 0; i < 2; i++) { objects.add(new byte[10*1024*1024]); } } private static void removeObjects() { System.out.println("Removing objects..."); int start = objects.size() - 1; int end = start - 2; for (int i = start; ((i >= 0) && (i > end)); i--) { objects.remove(i); } } } To build and run the code, use the following Maven command:
mvn package exec: exec
As soon as you compile and be ready for further action, run it and jvisualvm. If you have not used jvisualvm before, then you need to install the VisualGC plug-in: select Plugins in the Tools menu, then the Available Plugins tab. Select Visual GC and click Install.
You should see a list of JVM processes. Double-click on the volume in which your application runs (in this example, com.redstack.App) and open the Visual GC tab. Something like the one in the screenshot below should appear.
Please note that you can visually observe the state of the permanent generation, old generation, eden and survivor segments (S0 and S1). Colored columns show used memory. On the right is the historical view, which shows when the JVM performed garbage collections and the amount of memory in each of the segments.
In the application window, start creating objects (option 1) and watch what happens in Visual GC. Note that new objects are always created in eden. Now make a couple of objects unnecessary (option 2). You may not see the changes in Visual GC. This is because the JVM does not clean this space until the garbage collection procedure is complete.
To initiate the garbage collection, create more objects by filling in Eden. Please note what happens at the time of filling. If there is a lot of garbage in Eden, you will see how objects from Eden “move” to the survivor. However, if there is little rubbish in Eden, you will see objects moving into old generation. This happens when the objects that need to be left are larger than survival.
Also observe the gradual increase in Permanent Generation.
Try to fill in Eden, but not to the end, then throw away almost all the objects, leave only 20 MB. It turns out that Eden is mostly filled with garbage. After that create more objects. This time you will see that objects from Eden are being transferred to Survivor.
And now let's see what happens if we don’t have enough memory. Create objects until they are 460 mb. Please note that both Eden and Old Generation are almost completely filled. Create a couple more objects. When there is no more memory, the application will “fall” with the exception OutOfMemoryException. You may have already encountered similar behavior and wondered why it happened - especially if you had a large amount of physical memory on a computer and you were surprised how such a thing could happen, that there was not enough memory - now you know why. If it so happens that the Permanent Generation is full (quite difficult in the case of our example to achieve this), you will have another exception thrown, indicating that PermGen is full.
And finally, another way to see what was happening is to access the log. Here is a little bit of mine:
 13.373: [GC 13.373: [ParNew: 96871K-> 11646K (118016K), 0.1215535 secs] 96871K-> 73088K (511232K), 0.1216535 secs] [Times
 : user = 0.11 sys = 0.07, real = 0.12 secs]
 16.267: [GC 16.267: [ParNew: 111290K-> 11461K (118016K), 0.1581621 secs] 172732K-> 166597K (511232K), 0.1582428 secs] [Ti
 mes: user = 0.16 sys = 0.08, real = 0.16 secs]
 19.177: [GC 19.177: [ParNew: 107162K-> 10546K (118016K), 0.1494799 secs] 262297K-> 257845K (511232K), 0.1495659 secs] [Ti
 mes: user = 0.15 sys = 0.07, real = 0.15 secs]
 19.331: [GC [1 CMS-initial-mark: 247299K (393216K)] 268085K (511232K), 0.0007000 secs] [Times: user = 0.00 sys = 0.00, real
 = 0.00 secs]
 19.332: [CMS-concurrent-mark-start]
 19.355: [CMS-concurrent-mark: 0.023 / 0.023 secs] [Times: user = 0.01 sys = 0.01, real = 0.02 secs]
 19.355: [CMS-concurrent-preclean-start]
 19.356: [CMS-concurrent-preclean: 0.001 / 0.001 secs] [Times: user = 0.00 sys = 0.00, real = 0.00 secs]
 19.356: [CMS-concurrent-abortable-preclean-start]
  CMS: abort preclean due to time 24.417: [CMS-concurrent-abortable-preclean: 0.050 / 5.061 secs] [Times: user = 0.10 sys =
 0.01, real = 5.06 secs]
 24.417: [GC [YG occupancy: 23579 K (118016 K)] 24.417: [Rescan (parallel), 0.0015049 secs] 24.419: [weak refs processin
 g, 0.0000064 secs] [1 CMS-remark: 247299K (393216K)] 270878K (511232K), 0.0016149 secs] [Times: user = 0.00 sys = 0.00, rea
 l = 0.00 secs]
 24.419: [CMS-concurrent-sweep-start]
 24.420: [CMS-concurrent-sweep: 0.001 / 0.001 secs] [Times: user = 0.00 sys = 0.00, real = 0.00 secs]
 24.420: [CMS-concurrent-reset-start]
 24.422: [CMS-concurrent-reset: 0.002 / 0.002 secs] [Times: user = 0.00 sys = 0.00, real = 0.00 secs]
 24.711: [GC [1 CMS-initial-mark: 247298K (393216K)] 291358K (511232K), 0.0017944 secs] [Times: user = 0.00 sys = 0.00, real
 = 0.01 secs]
 24.713: [CMS-concurrent-mark-start]
 24.755: [CMS-concurrent-mark: 0.040 / 0.043 secs] [Times: user = 0.08 sys = 0.00, real = 0.04 secs]
 24.755: [CMS-concurrent-preclean-start]
 24.756: [CMS-concurrent-preclean: 0.001 / 0.001 secs] [Times: user = 0.00 sys = 0.00, real = 0.00 secs]
 24.756: [CMS-concurrent-abortable-preclean-start]
 25.882: [GC 25.882: [ParNew: 105499K-> 10319K (118016K), 0.1209086 secs] 352798K-> 329314K (511232K), 0.1209842 secs] [Ti
 mes: user = 0.12 sys = 0.06, real = 0.12 secs]
 26.711: [CMS-concurrent-abortable-preclean: 0.018 / 1.955 secs] [Times: user = 0.22 sys = 0.06, real = 1.95 secs]
 26.711: [GC [YG occupancy: 72983 K (118016 K)] 26.711: [Rescan (parallel), 0.0008802 secs] 26.712: [weak refs processin
 g, 0.0000046 secs] [1 CMS-remark: 318994K (393216K)] 391978K (511232K), 0.0009480 secs] [Times: user = 0.00 sys = 0.00, rea
 l = 0.01 secs]
In the log you can see what happened in the JVM - note that the algorithm used is the Concurrent Mark Sweep Compact Collection algorithm (CMS), there is a description of the stages and YG - Young Generation.
You can use these settings in the "production". There are even tools that visualize the log.
Well, that ended our brief introduction to the theory and practice of the JVM garbage collection. I hope that the example application helped you to clearly understand what is happening in the JVM when your application is running.
Thanks to Rupesh Ramachandran for what he taught me about the JVM and garbage collection settings.
Source: https://habr.com/ru/post/112676/
All Articles